Creator Business Tracker
$14.99
Your money comes from five places and none of them talk to each other.
TikTok Shop pays out on its schedule. Amazon pays about two months after the sale. A brand pays net 30, or says it will. UGC fees land in another app, and the template you sold shows up as a deposit with no name on it. At the end of the month you have a rough idea of what came in and no idea where it came from, who still owes you, or what you should be saving for taxes.
This tracker puts all of it in one place. Log payouts as they land, add a brand deal the day you pitch it, and drop in what you spend. The dashboard does the rest: income by month and by source, profit for the year, money still owed on brand deals, and a set-aside number for each IRS payment period.
No apps to connect. No subscription. No formulas to write.
I'm Ellyn Perry, and I made this tracker for creators whose money lands in too many places to keep straight.
What you get, tab by tab
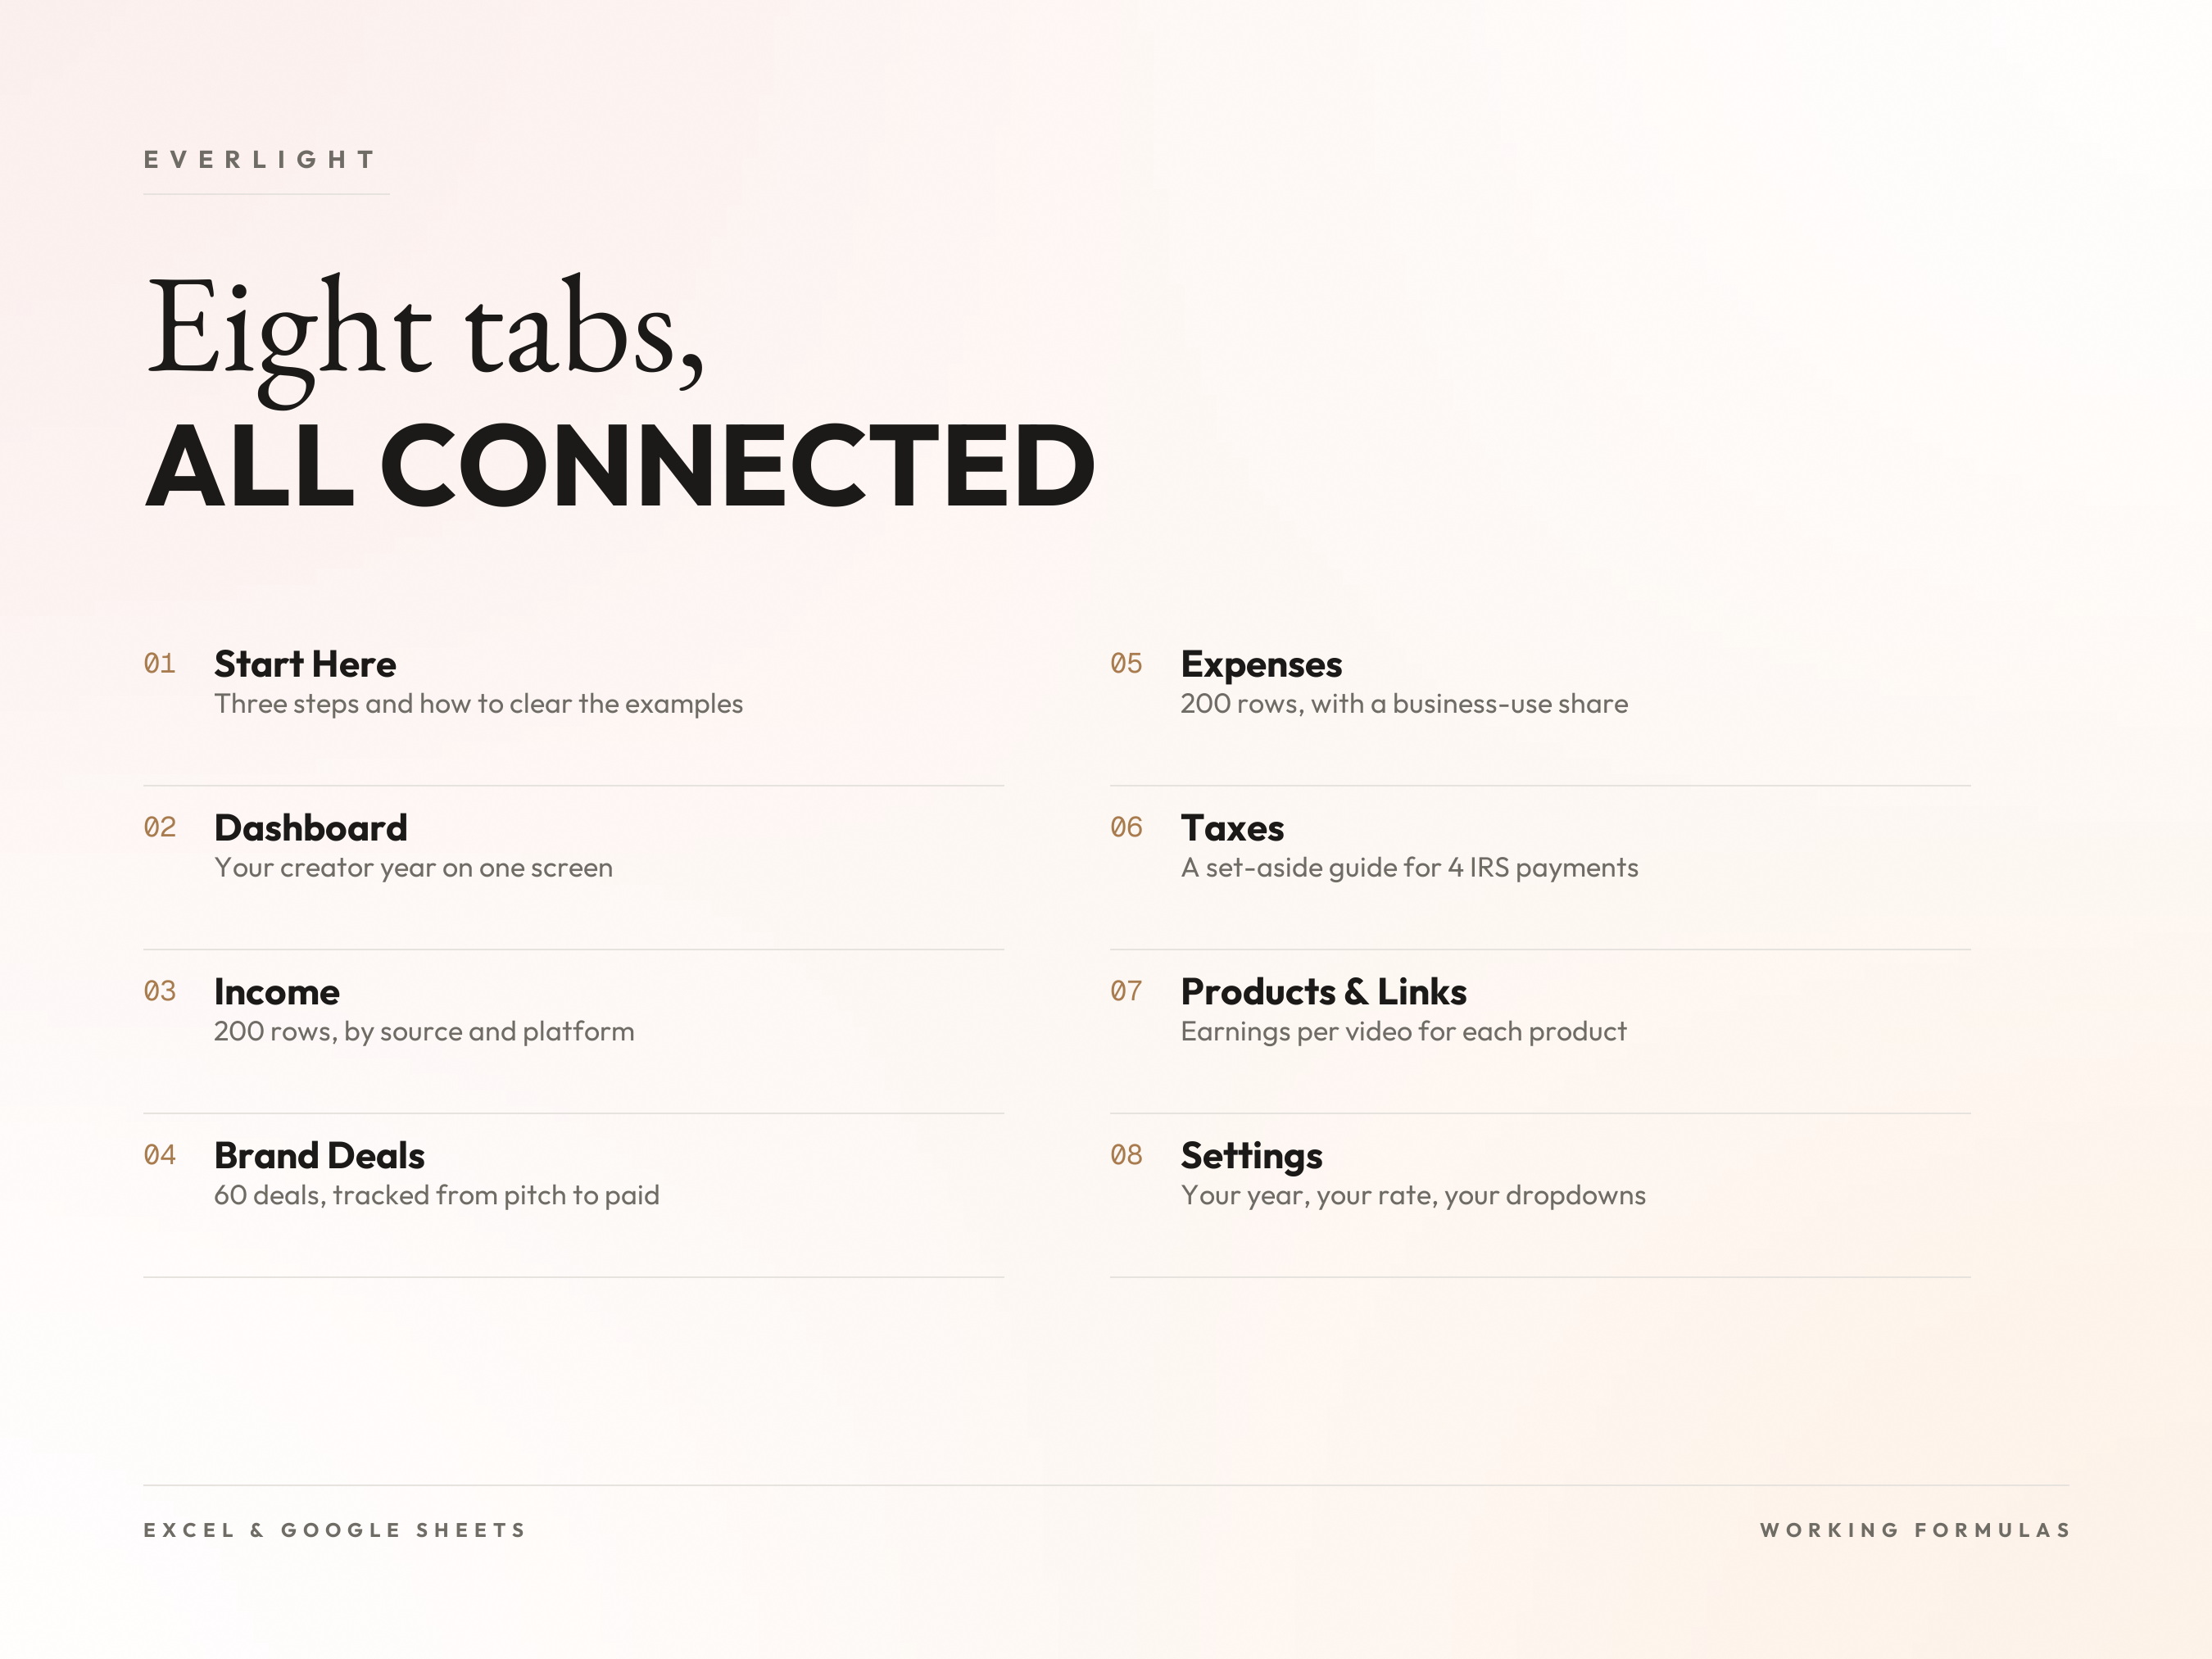
Start Here. Three setup steps, what each tab does, and a table showing exactly which cells to select to clear the example data.
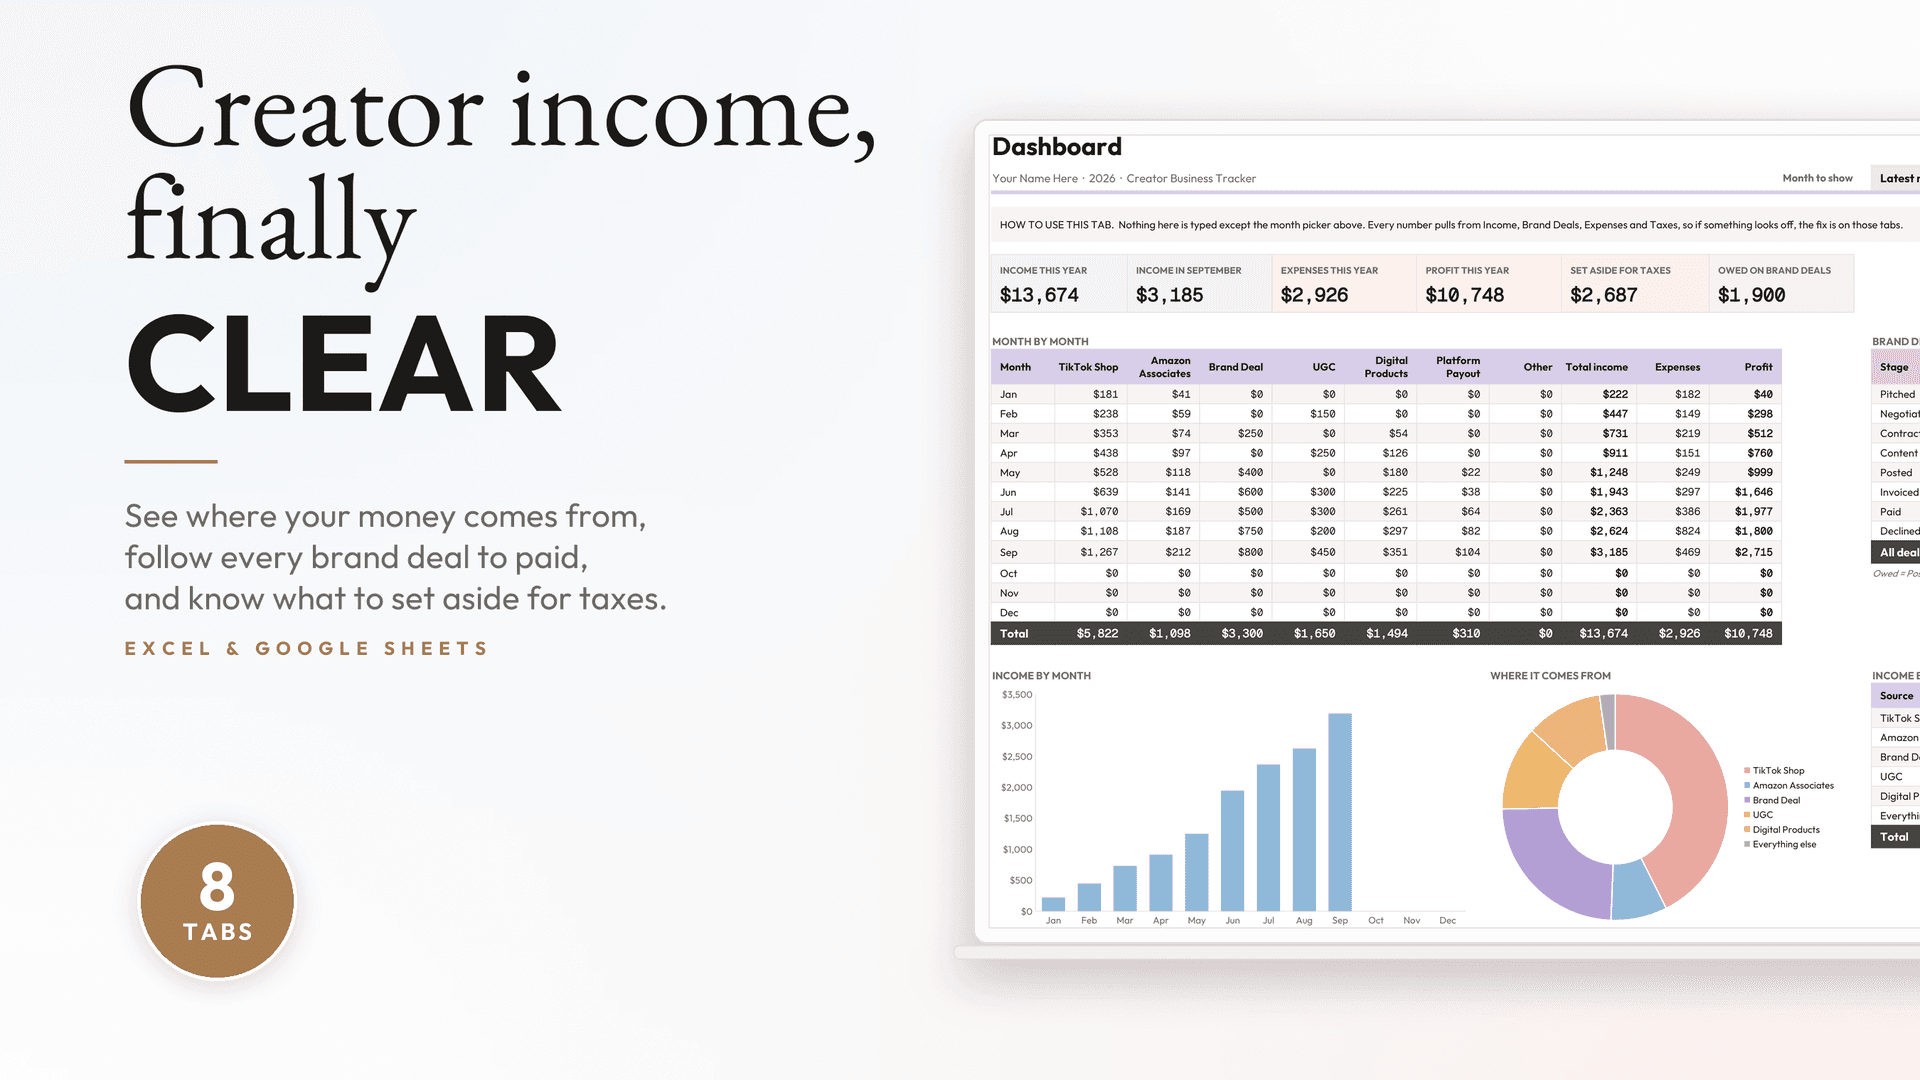
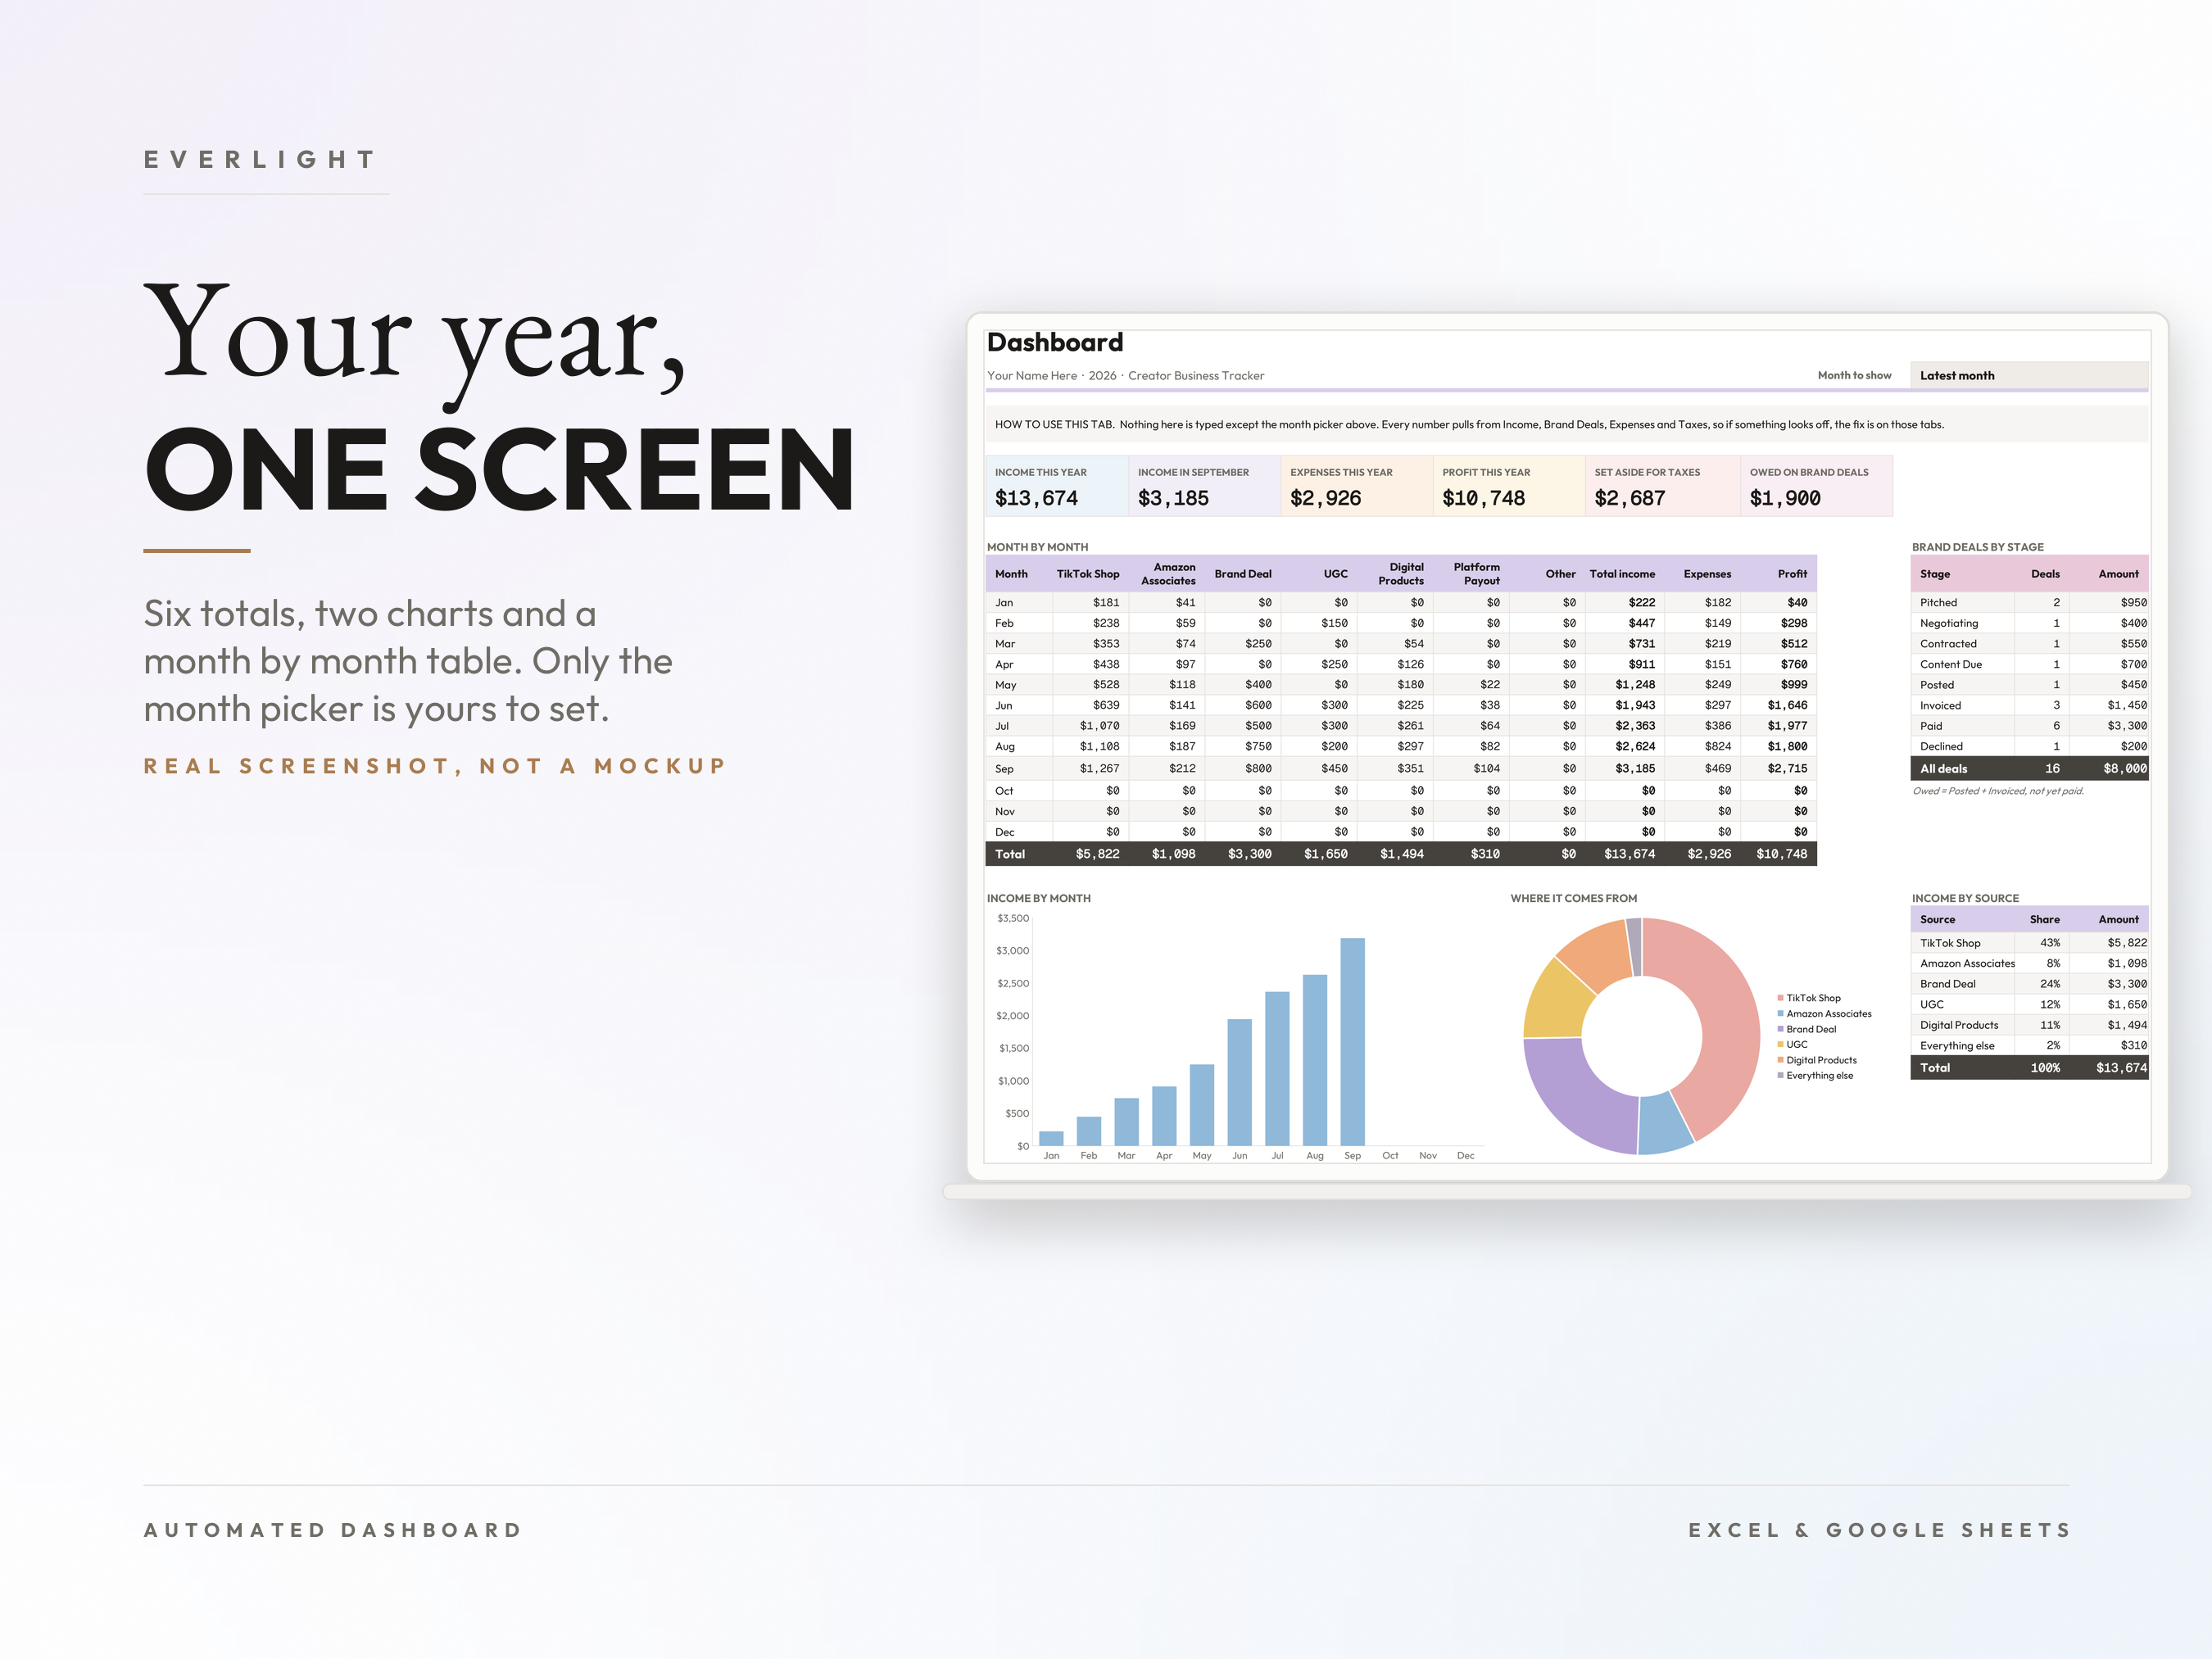
Dashboard. Six totals at the top: income this year, income for any month you pick, expenses, profit, set aside for taxes, and money owed on brand deals. Below that, a month by month table split by income source, your brand deals by stage, and two charts: income by month and where it comes from. Only the month picker is yours to set.
Income. One row per payout or payment, with source, platform and Paid or Pending. 200 rows with dropdowns.
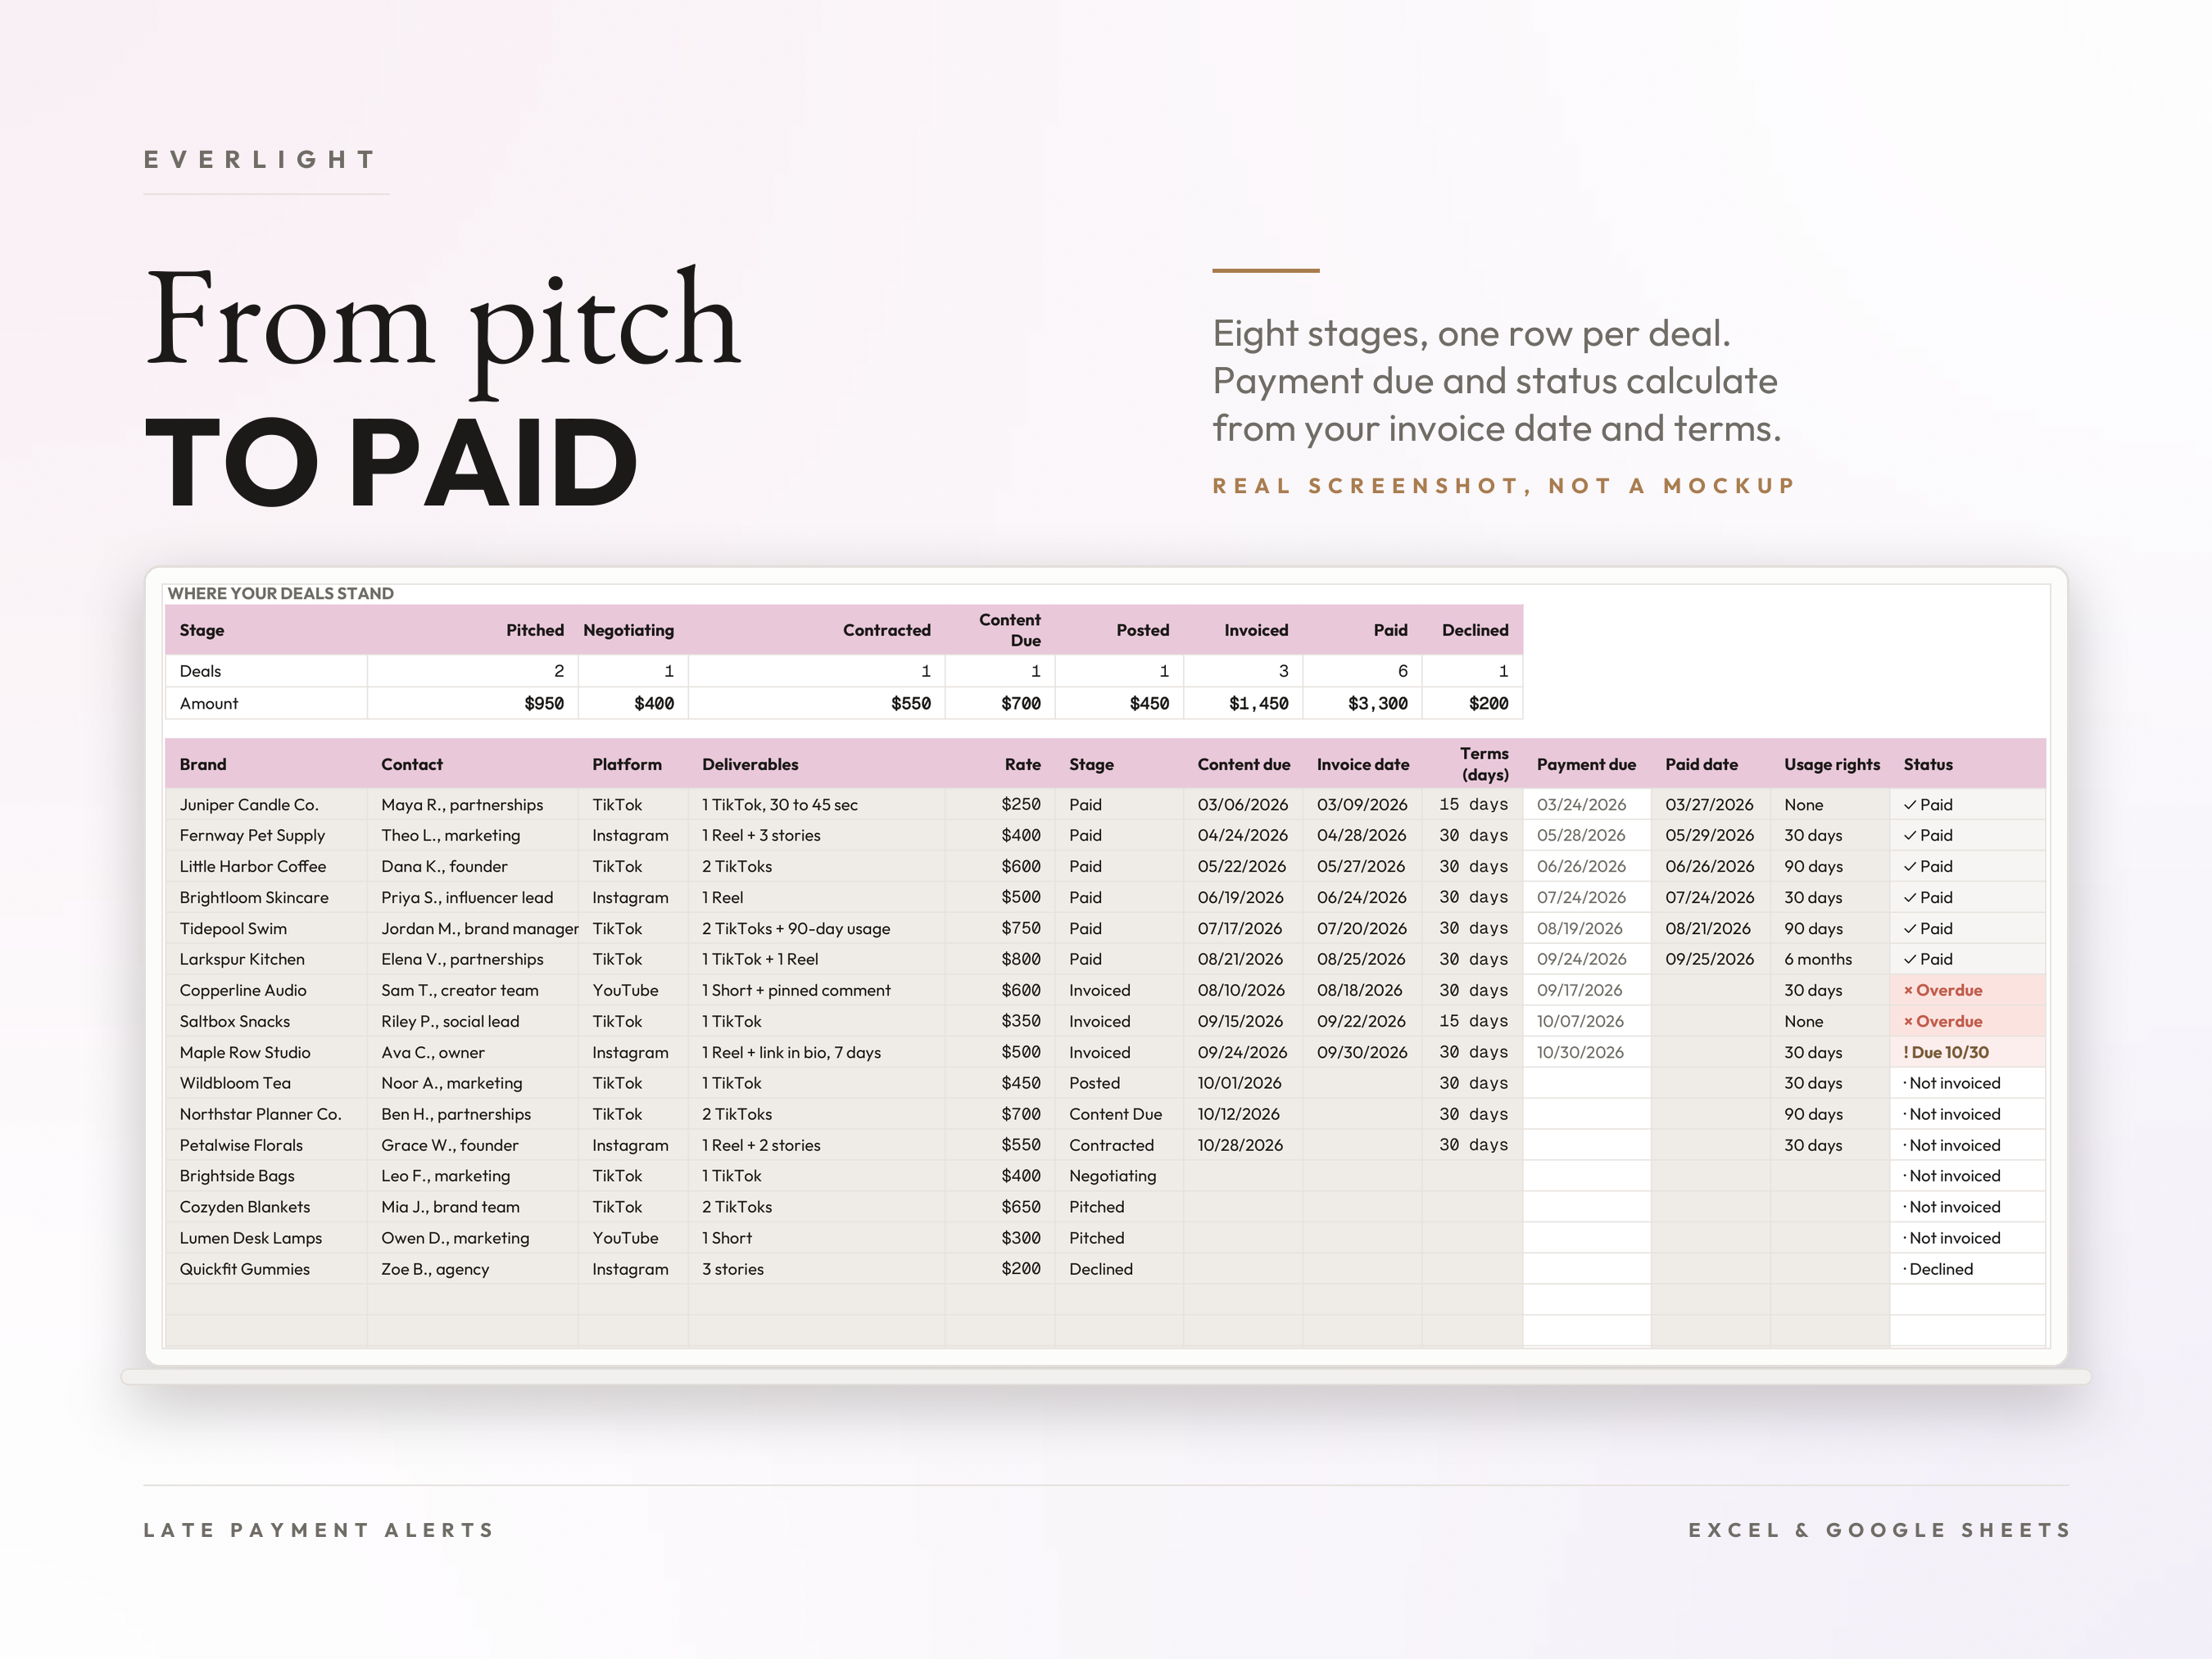
Brand Deals. Every deal from pitch to paid across eight stages: Pitched, Negotiating, Contracted, Content Due, Posted, Invoiced, Paid, Declined. Track rate, deliverables, content due date, invoice date, payment terms and usage rights. Payment due calculates from your invoice date and terms, and the status column flags each deal as ✓ Paid, ! Due, or × Overdue. 60 rows.
Expenses. One row per purchase. If something is only partly for the business, like your phone plan, type the business share and only that part counts. 200 rows.
Taxes. A savings target for each of the 4 IRS estimated payment periods, at the set-aside rate you choose. Log what you actually moved to savings and it shows whether you are covered or short. This is a savings guide, not tax advice. It does not calculate what you owe.
Products & Links. Price, commission, videos posted and sales for every product you promote, with earnings per sale, earnings per video, and your best earner per video called out at the top. 50 rows.
Settings. Your name, your year, your set-aside rate, and every dropdown list. Rename an income source here and the dropdowns and Dashboard follow.
Who it's for
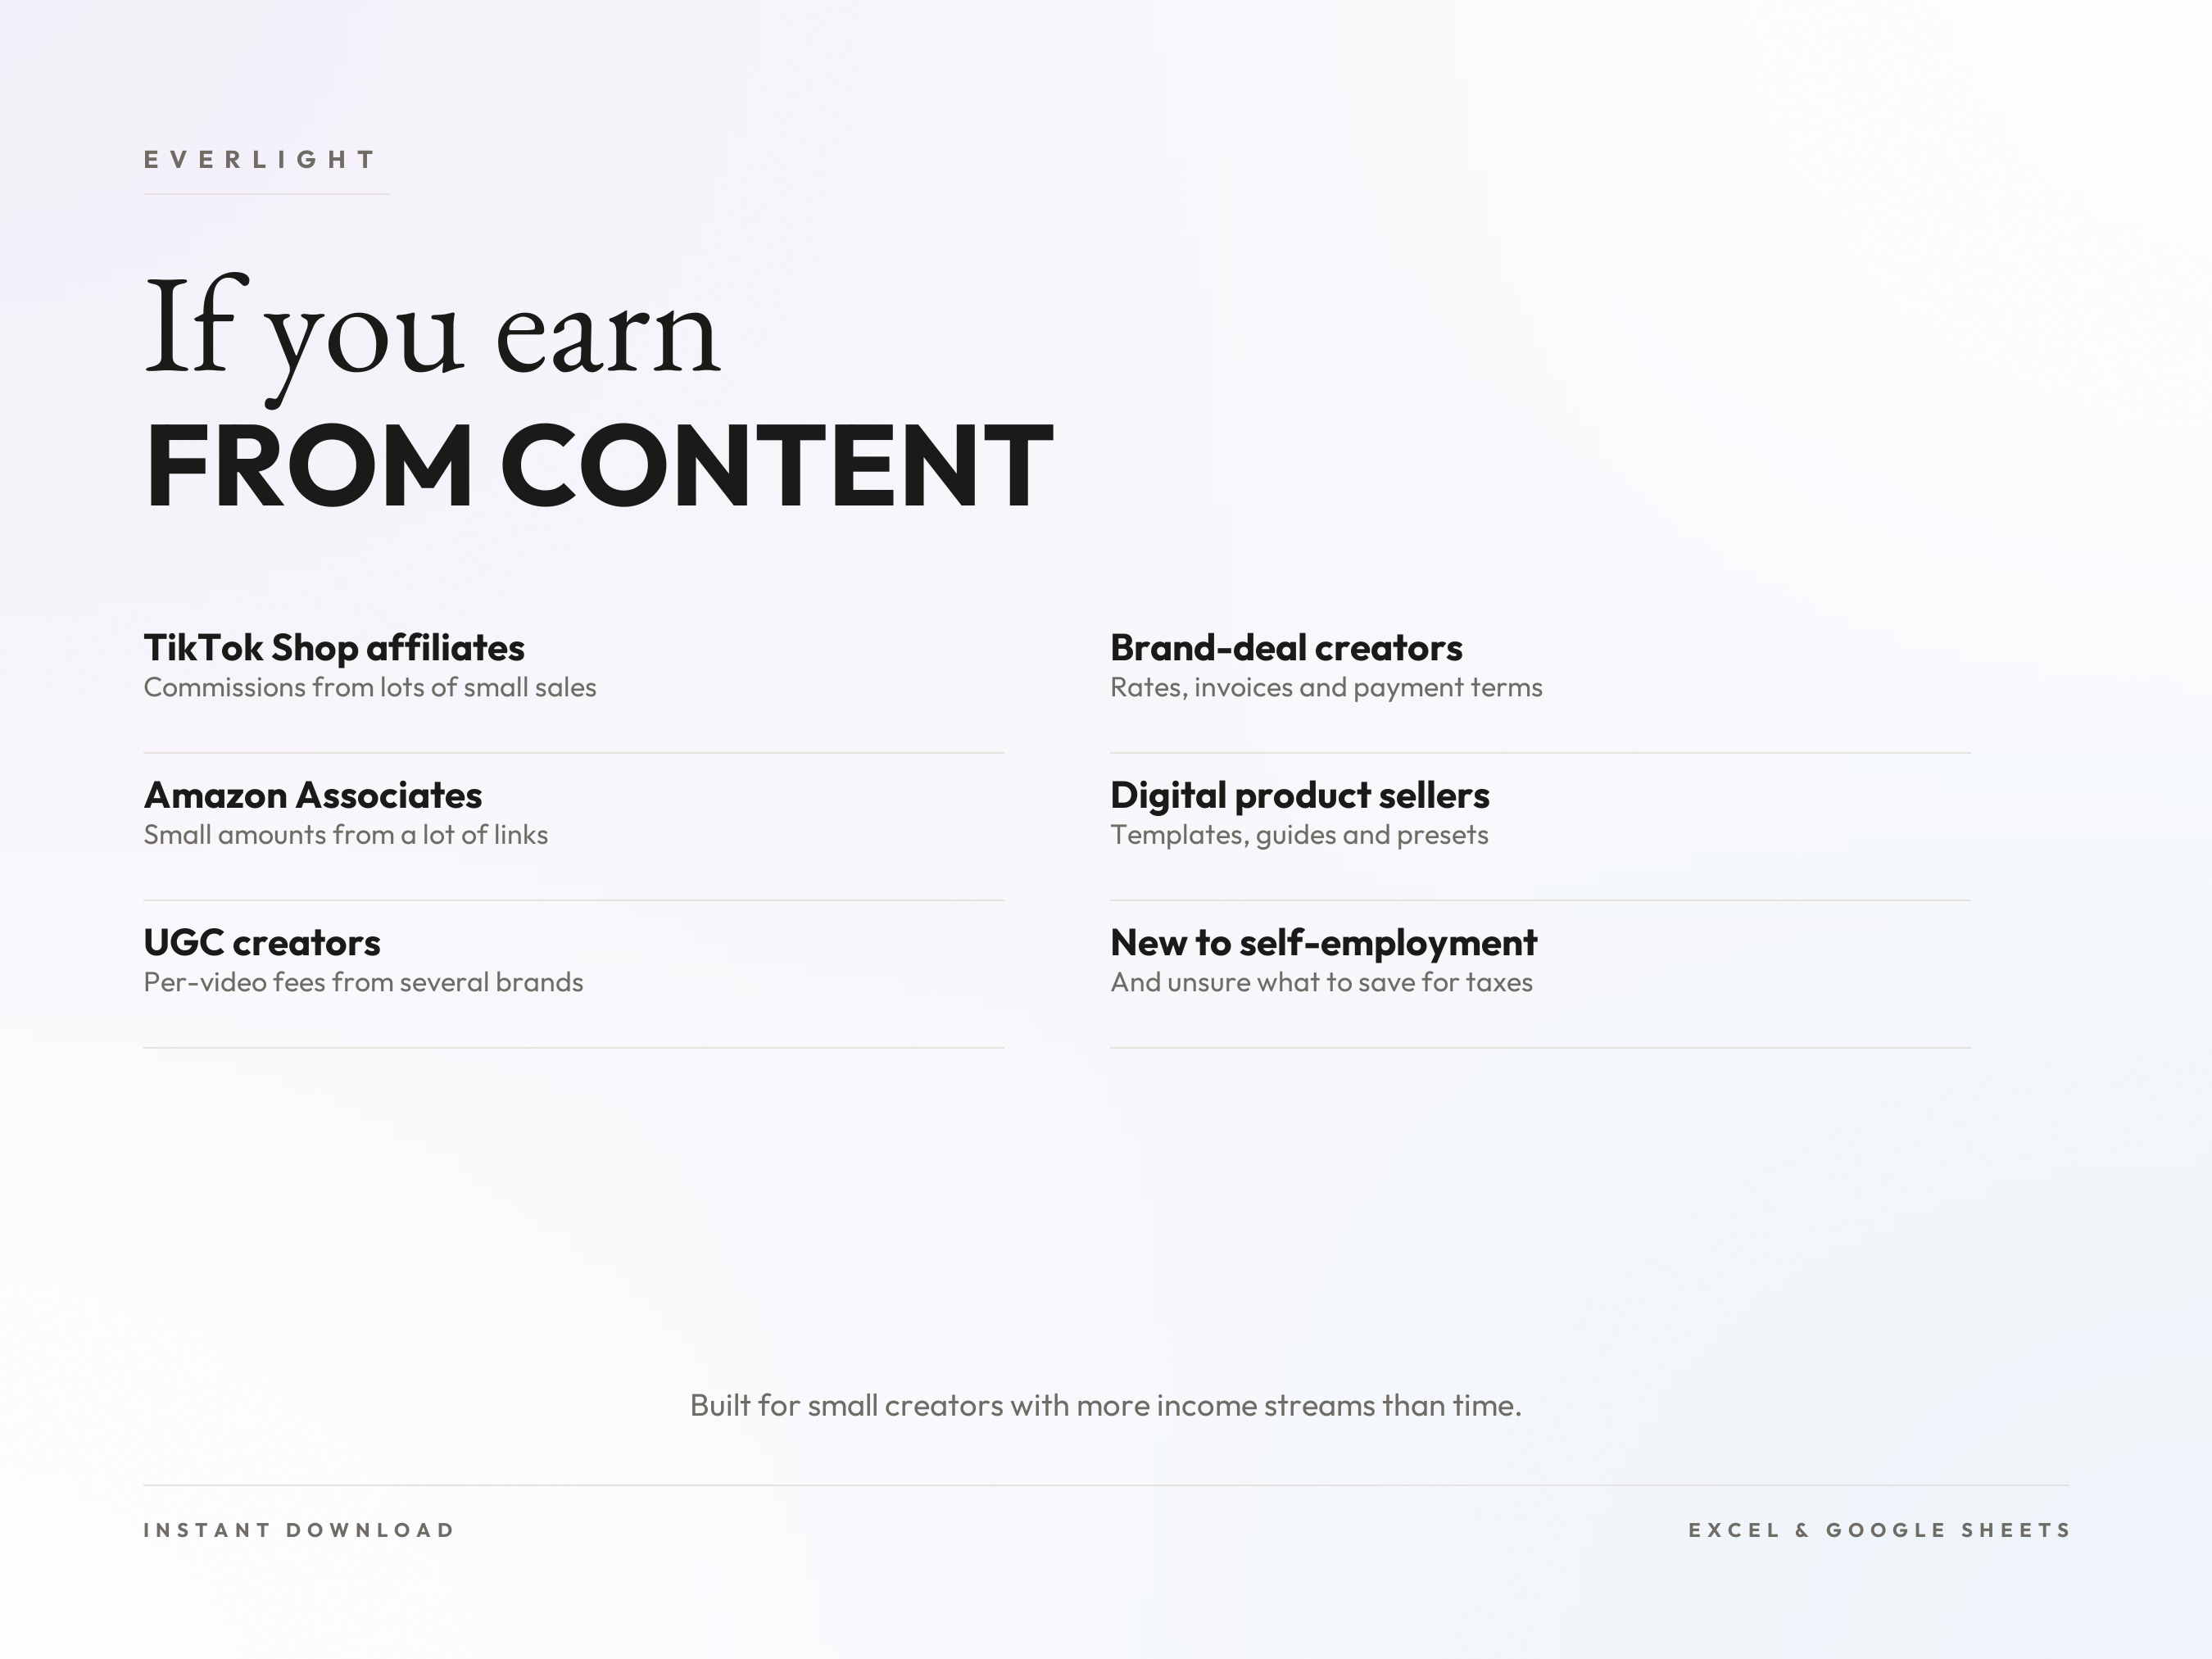
Built for small creators with more income streams than time.
TikTok Shop affiliates
Amazon Associates
UGC creators paid per video
Creators who take brand deals and send invoices
Anyone selling their own templates, guides or presets
Anyone new to self-employment and unsure what to save for taxes
How it works
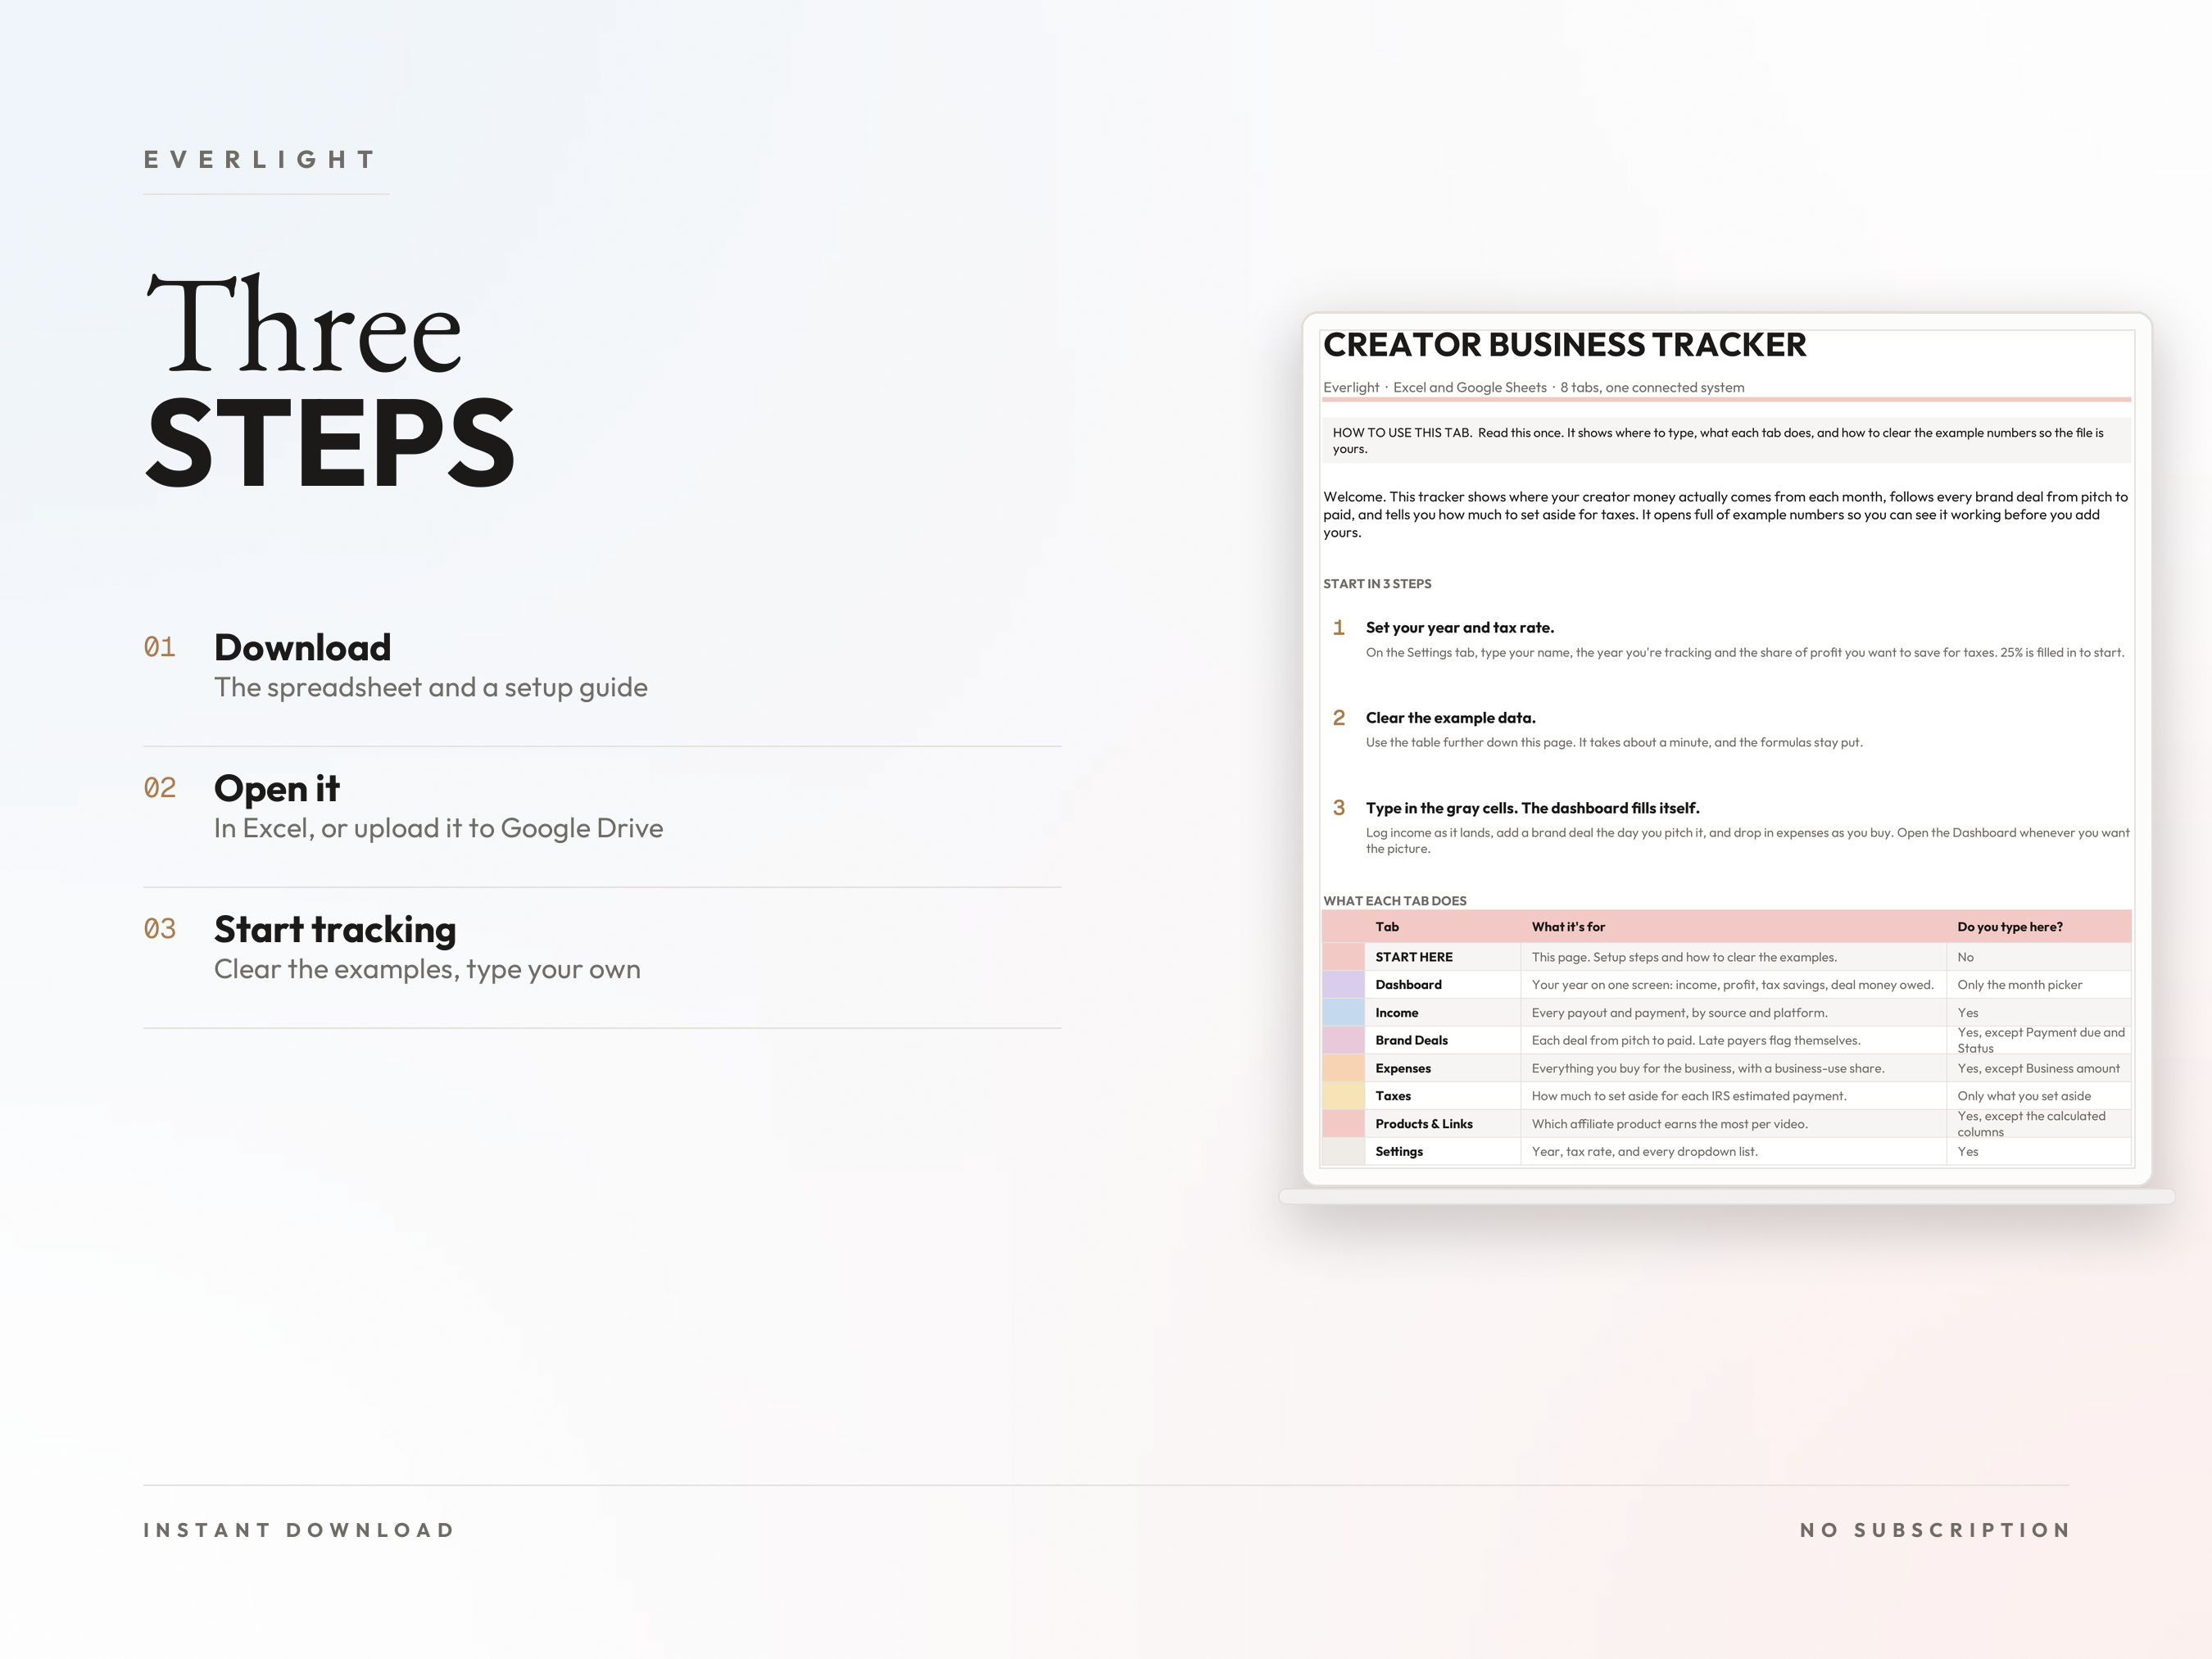
Step 1. Download the ZIP. Inside are the spreadsheet and a short setup guide.
Step 2. Open it in Excel, or upload it to Google Drive and choose File > Save as Google Sheets. A free Google account works.
Step 3. Make it yours. Put your name, year and set-aside rate on Settings, clear the example rows, and start typing in the gray cells. The dashboard fills itself.
Why this one
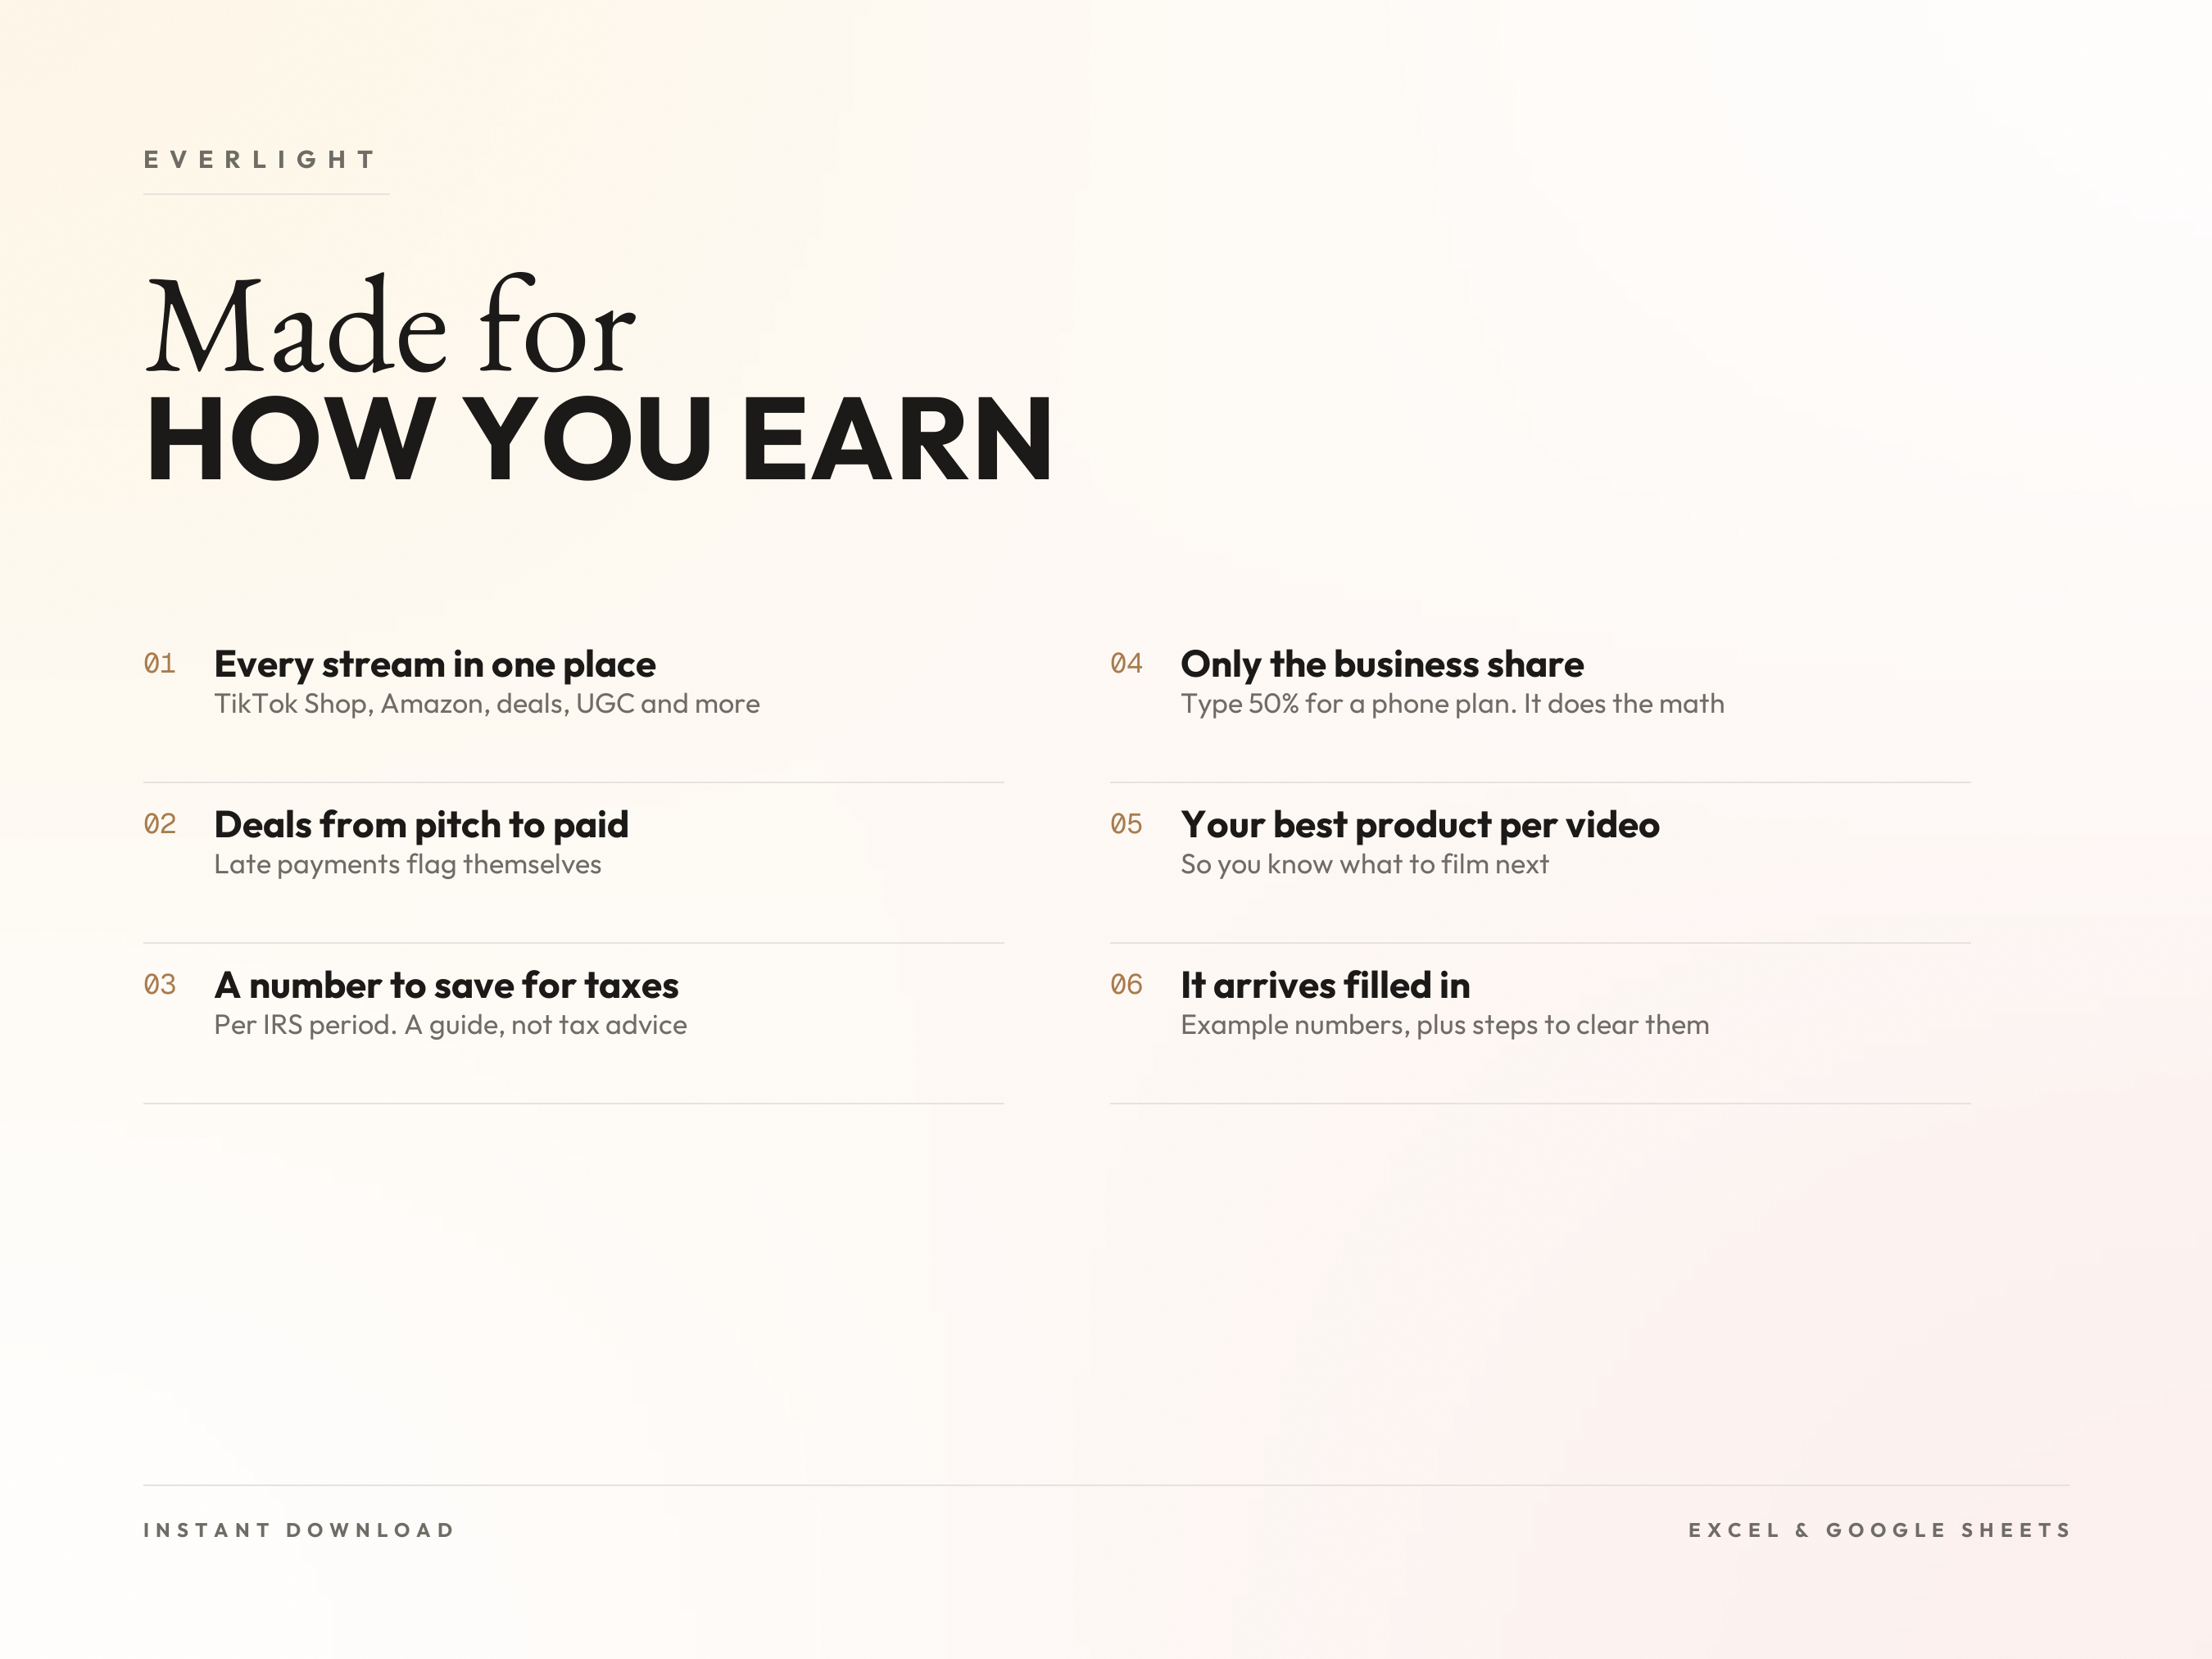
It knows where your money comes from. Every dollar is tagged by source and platform, so you can see whether TikTok Shop, brand deals or your own products are actually carrying the month.
Late payers flag themselves. Enter an invoice date and terms, and the deal turns to × Overdue the day the payment is late.
A number to save, every period. No more guessing in April. You choose the rate; the file does the math for each IRS period. A guide, not tax advice.
It arrives filled in. Realistic example numbers so you can see it working, plus clear steps to remove them.
You only touch the gray cells. In Excel, formula cells are locked so a stray keystroke cannot break the dashboard.
Color that means something. Every status carries a word and a mark as well as a color, so it still reads in black and white.
What this is, and what it is not
It is a spreadsheet. It tracks, calculates and reports on numbers you type or paste in.
It does not connect to TikTok, Amazon, Etsy or your bank, it does not import anything automatically, and it does not file taxes or tell you what you owe. The Taxes tab is a savings guide. Ask a tax professional what rate fits you. Every screenshot on this page is the actual file, not a mockup.
File details
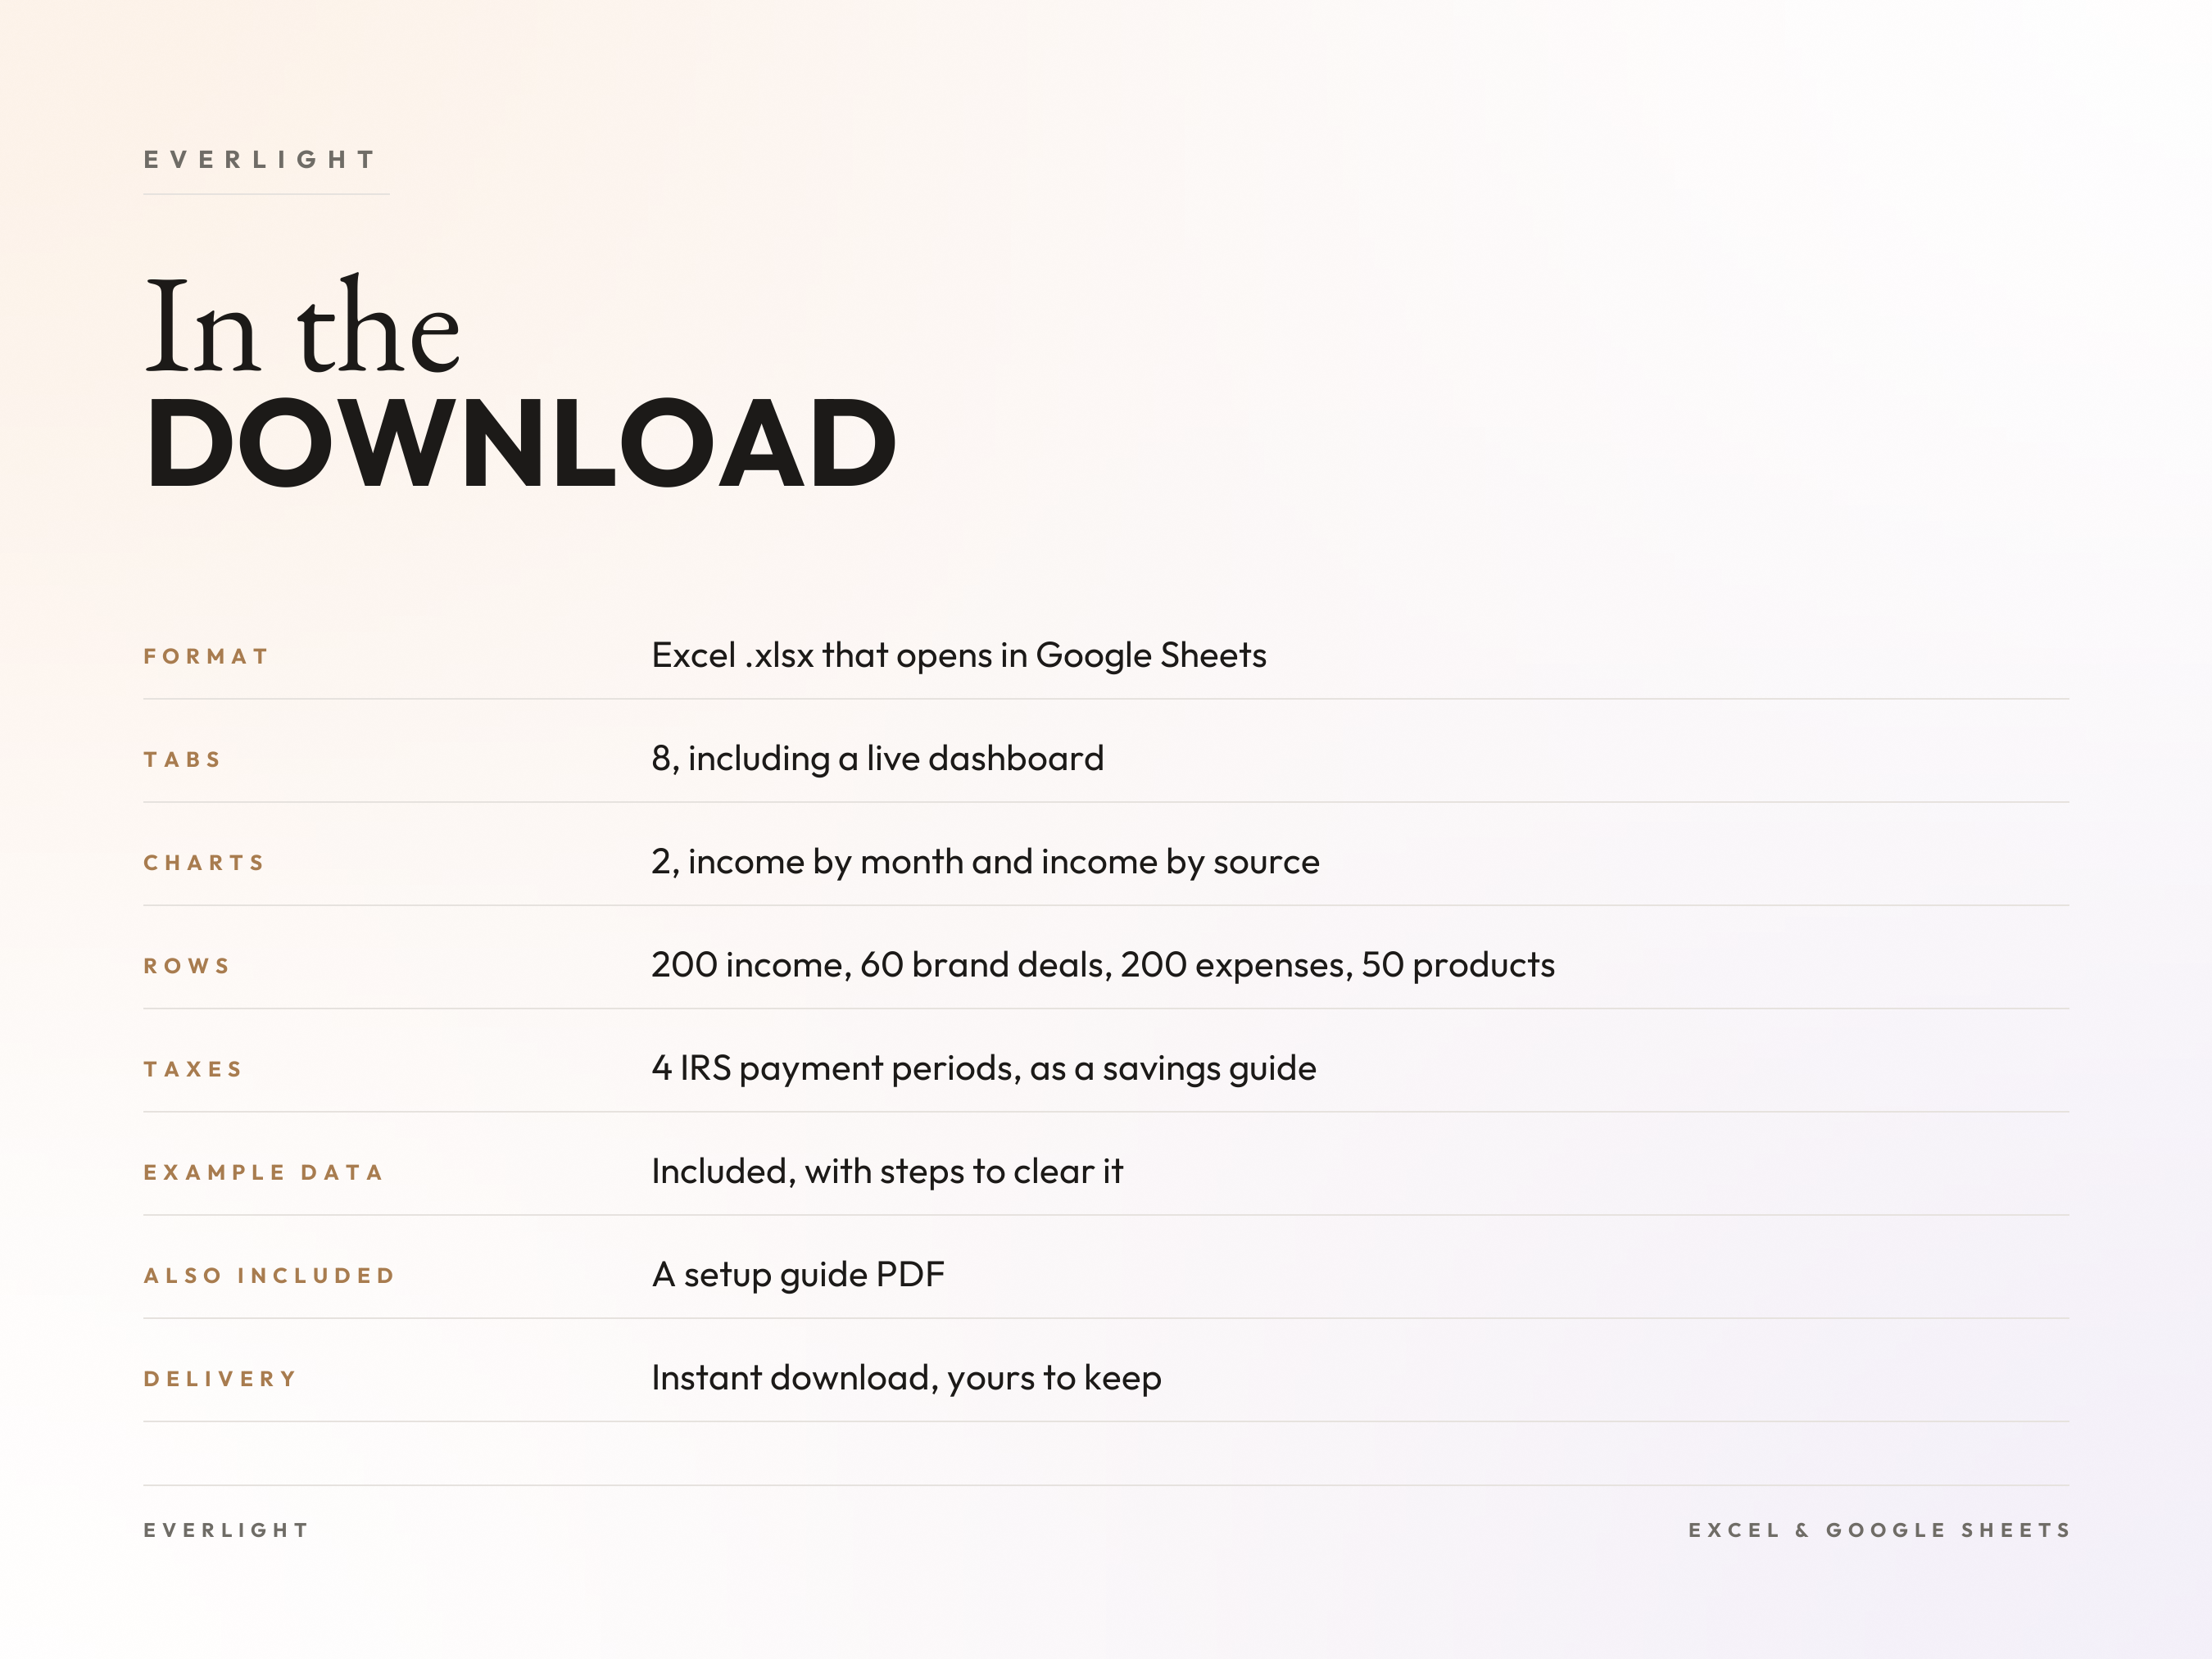
Format: Excel .xlsx. Opens in Excel, or in Google Sheets with a free Google account
Tabs: 8, including a live dashboard with 2 charts
Rows: 200 income, 60 brand deals, 200 expenses, 50 products
Taxes: 4 IRS estimated payment periods
Also included: a 3-page setup guide (PDF)
Fonts: Outfit and Geist Mono, both free. In Excel, a default font fills in if they are not installed, and everything still works. Google Sheets may substitute a similar font
Instant digital download. Your files are ready right after purchase, and they are yours to keep.
Stuck? Reply to your order email and I'll help.