SQL & Python Challenge: Build Your Portfolio
$99$129
Do you want a portfolio project that actually looks like real analyst work?
Most portfolio projects look the same. A sales dataset, a few charts, a dashboard. Hiring managers have seen it a hundred times.
This is different.
The SQL & Python Challenge is a full simulation of the kind of complex, ambiguous, high-pressure analysis that analysts solve at work every day. You'll receive a realistic compliance brief from a manager — the kind that lands in your inbox on a Tuesday morning with a tight deadline — and your job is to answer it.
The scenario: a banking regulator has issued new guidance restricting certain customers from holding multiple credit cards. Your Compliance team needs to know how many customers are affected and what the revenue impact is. You have two datasets, a deadline, and a set of evolving requirements as the manager follows up with additional questions.
This challenge was built from my real experience as an Analytics Manager.
The brief, the follow-up emails, the changing requirements, the pressure to deliver — I recreated all of it deliberately, because that is what the job actually looks like. Nobody tells you the requirements upfront. Nobody waits patiently while you figure it out. The dataset is synthetic and the scenario is fictional, but the experience of working through it is as close to real analyst work as a portfolio project can get.
Everything included:
🏦 Banking compliance challenge with realistic manager briefs
📧 Evolving requirements via follow-up emails — just like real work
🗃️ 2 datasets to work with
💡 Hints and instructions so you never get completely stuck
✅ Full SQL solution file
🐍 Full Python solution file
📊 Final presentation task
🎁 Bonus: Complete ShopTrend e-commerce project (second portfolio piece)
🎨 Bonus: Fully completed Notion portfolio template
Total: 2 complete portfolio projects you can show employers
What you'll practise:
SQL: window functions, CTEs, multi-step joins, latest-record logic, data cleaning, revenue modelling, tenure buckets and segmentation
Python: the same analysis rebuilt in pandas — filtering, grouping, joining, and presenting results
Business thinking: interpreting an ambiguous brief, handling changing requirements, and presenting findings in a format a non-technical stakeholder can act on
What you'll get in details:
2 realistic datasets built to mirror real analyst work
A multi-step challenge with several "urgent manager emails" that evolve as you progress
SQL and Python solution files so you can check your work and understand the approach
A final presentation task — the same format used in real analytics teams
A completed, portfolio-ready case study you can show employers and discuss in interviews
Bonus: Second Portfolio Project Included
To give you even more to show employers, this challenge includes a complete second project as a free bonus.
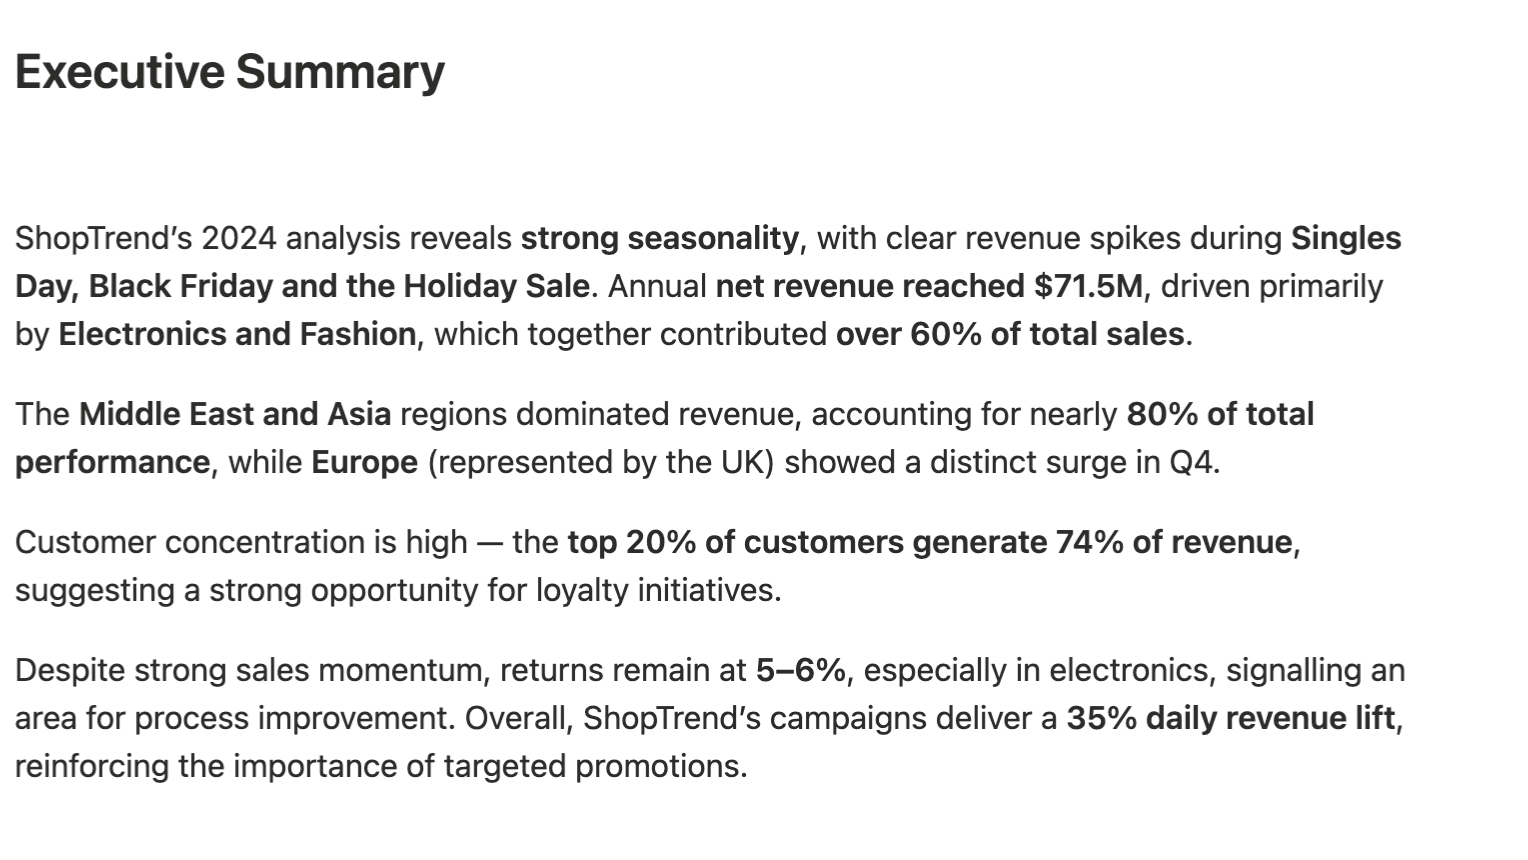
The ShopTrend 2024 Python Project covers e-commerce analysis — customer behaviour, sales trends, product performance, and campaign effectiveness. It's a different dataset, a different industry, and a different set of techniques, which means you leave with two portfolio projects that demonstrate range.
What's included in the bonus:
A step-by-step Jupyter notebook walking through the full analysis, from business question to visualisations using Matplotlib, Seaborn, and Plotly
A synthetic e-commerce dataset with seasonality, missing values, and realistic errors
A Python script to generate the dataset yourself, adjustable by row count, period, and data types
A ready-to-use AI prompt if you'd rather generate the data without running a script
A list of alternative datasets if you want to practise further
A 9-step data analysis workflow covering question definition, cleaning, analysis, validation, visualisation, and presentation
A fully completed Notion portfolio template showing exactly how to present your work professionally — business questions framed, findings documented, recommendations structured, visuals displayed
This is not a second course. It is a second complete project, ready to go into your portfolio alongside the banking compliance challenge.
This is for you if:
You have SQL or Python basics but no real project to show
You've been rejected from analyst roles and suspect your portfolio is the problem
You want to practise the kind of thinking that comes up in technical interviews and case studies
You're transitioning into data from finance, admin, or another field and need something credible to anchor your portfolio
By the end, you won't just have a project. You'll have something you can point to and say: this is what analysts actually do — and I can do it.
This challenge is inspired by real analytical workflows. All datasets are synthetically generated. All occupations, rules, business logic, and figures are fictional and do not represent any real company, regulator, or internal process. This product is for educational and training purposes only.