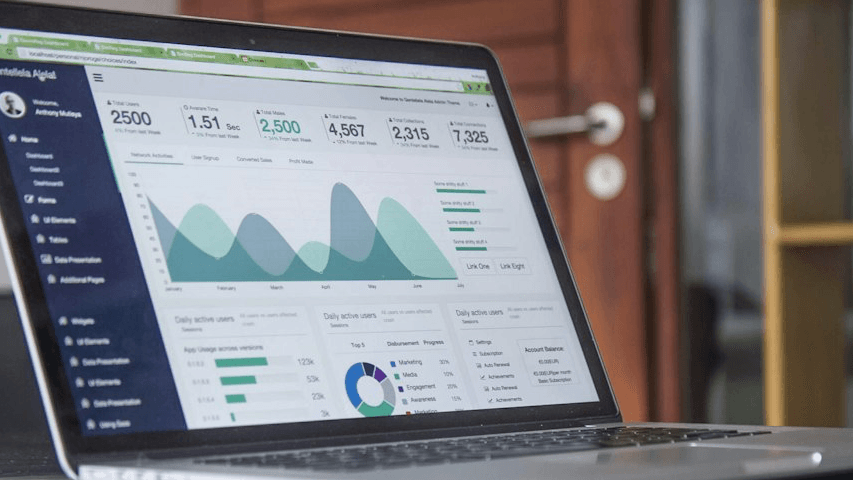
Tableau Dashboards for Beginners Course
$5$15
Turn a plain spreadsheet into a clear, interactive sales dashboard you can share with a link. This beginner course walks you through every step, from installing Tableau to publishing your finished work. No coding and no past Tableau experience are required.
What you will build:
A one-page Sales Performance dashboard with KPI cards, a sales trend line, a map by state, a bar chart by category, and filters that update every chart at once.
What is inside:
7 short modules, taken in order
Hands-on exercises and a checkpoint for each module
A final project with a 100-point grading rubric
A knowledge check with answers
A plain-language glossary of key terms
About 6 to 8 hours of guided work