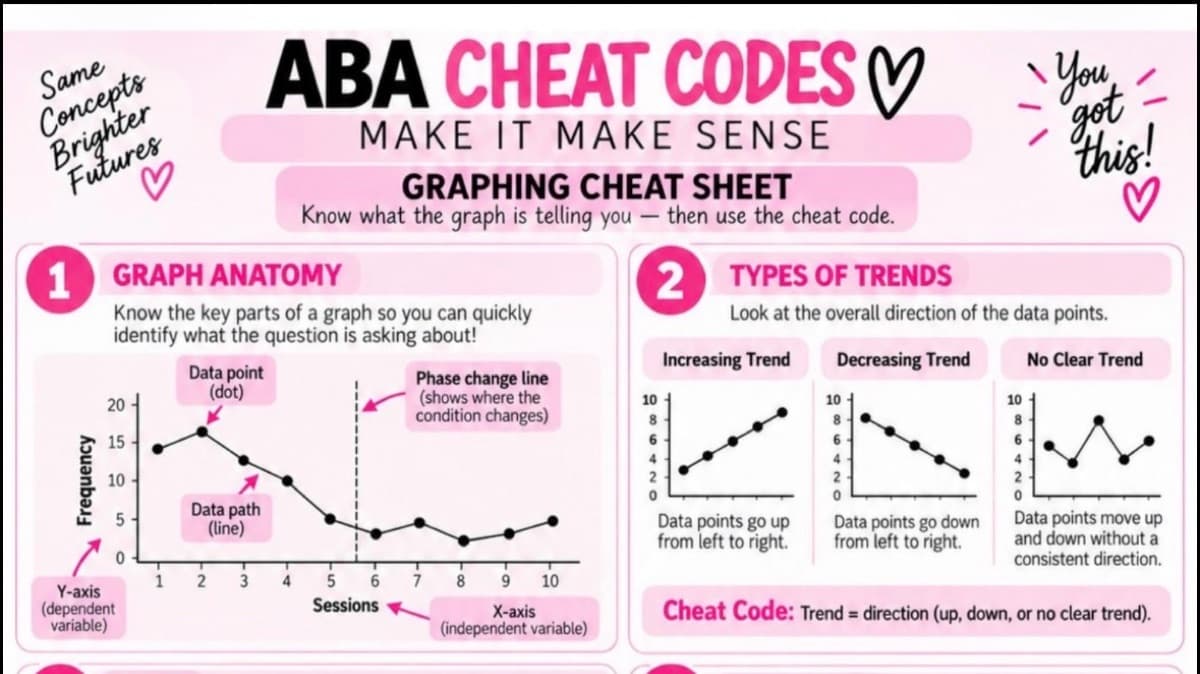
Graphing & Data Collection Cheat Sheet
$2.99
Graphing and data collection don’t have to be confusing!
This visual cheat sheet breaks down:
- Graph anatomy and phase-change lines
- Trend, level, and variability
- Baseline, intervention, and follow-up
- Maintained vs. non-maintained responding
- Frequency, rate, duration, latency, and IRT
- Percentage and mean
- Continuous and discontinuous measurement
- Partial interval, whole interval, and momentary time sampling
Perfect for RBT exam preparation, live study practice, and quick review. Download it instantly and make graphing make sense one cheat code at a time!