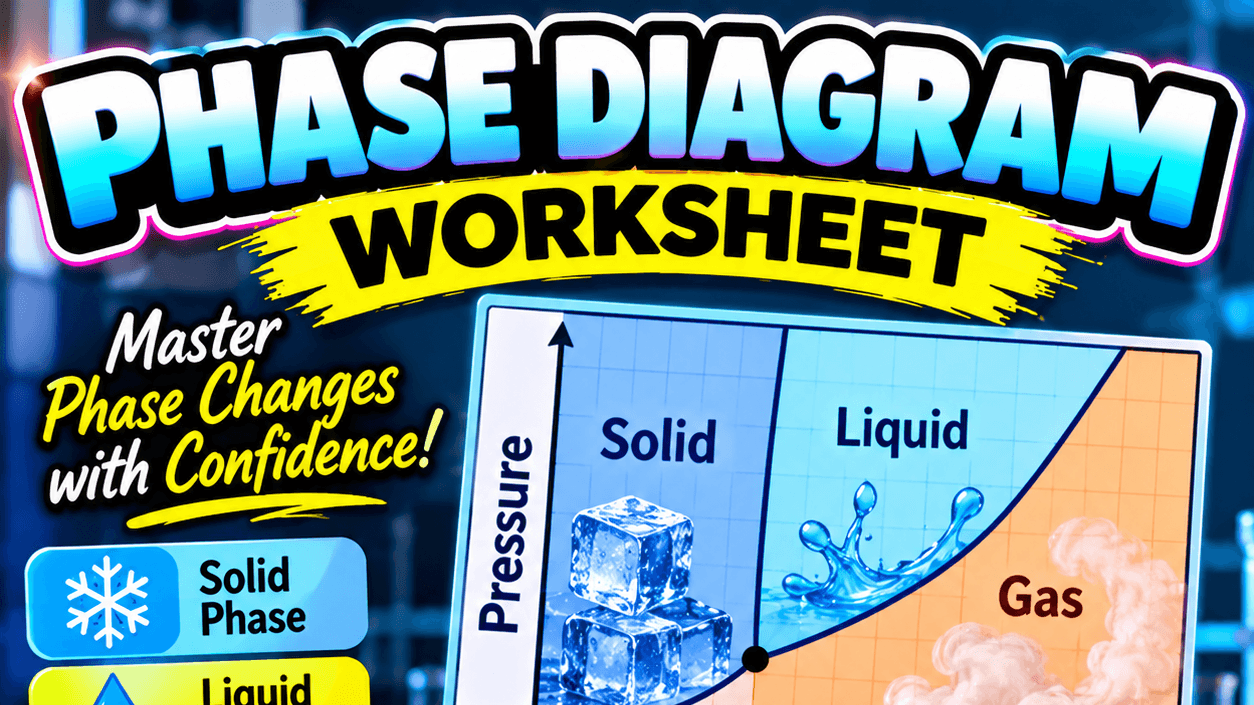
Phase Diagrams Worksheet + Key
$14
Help your students read and interpret phase diagrams with confidence. This worksheet guides students through three different phase diagrams, two real substances and one practice compound, so they learn to identify phases, read key points, predict phase changes and connect phase diagrams to real life.
Use it for classwork, homework, review, or a sub plan.
What’s included:
A clear introduction explaining what a phase diagram shows, plus key vocabulary: triple point, critical point, normal melting and boiling points, and normal sublimation point.
Part A: Carbon dioxide (questions 1–9). Using a phase diagram built from real CO₂ data, students:
label the solid, liquid and gas regions
estimate the triple point, normal sublimation point and critical point
label the equilibrium curves
explain why dry ice sublimes instead of melting
use the slope of the melting curve to compare the density of solid and liquid CO₂
answer circle-the-correct-word questions on phase changes
Part B: Compound Z (questions 10–16). A gridded phase diagram for reading exact values. Students find the triple and critical points, identify phases under given conditions, and trace phase changes as temperature and pressure change.
Part C: Water (questions 17–22). Real-world applications such as freeze-drying, boiling water on Mount Everest, pressure cookers, why ice floats, and supercritical water.
Complete answer key with fully labelled diagrams for all three parts, plus clear explanations for every answer.
Why teachers love it:
Students go beyond labelling a diagram. They use it to predict what happens when conditions change and to explain everyday things like dry ice, pressure cookers and floating ice, which builds real understanding of phase changes.
Details:
9 pages (6-page worksheet + 3-page answer key). Printable PDF. Best for high school chemistry (Grades 9–12).
Pairs well with my Phase Change Problems worksheet for a complete unit on states of matter and phase changes.