Organizer Builder Pack
$13
For the person whose spreadsheets are basically a love language.
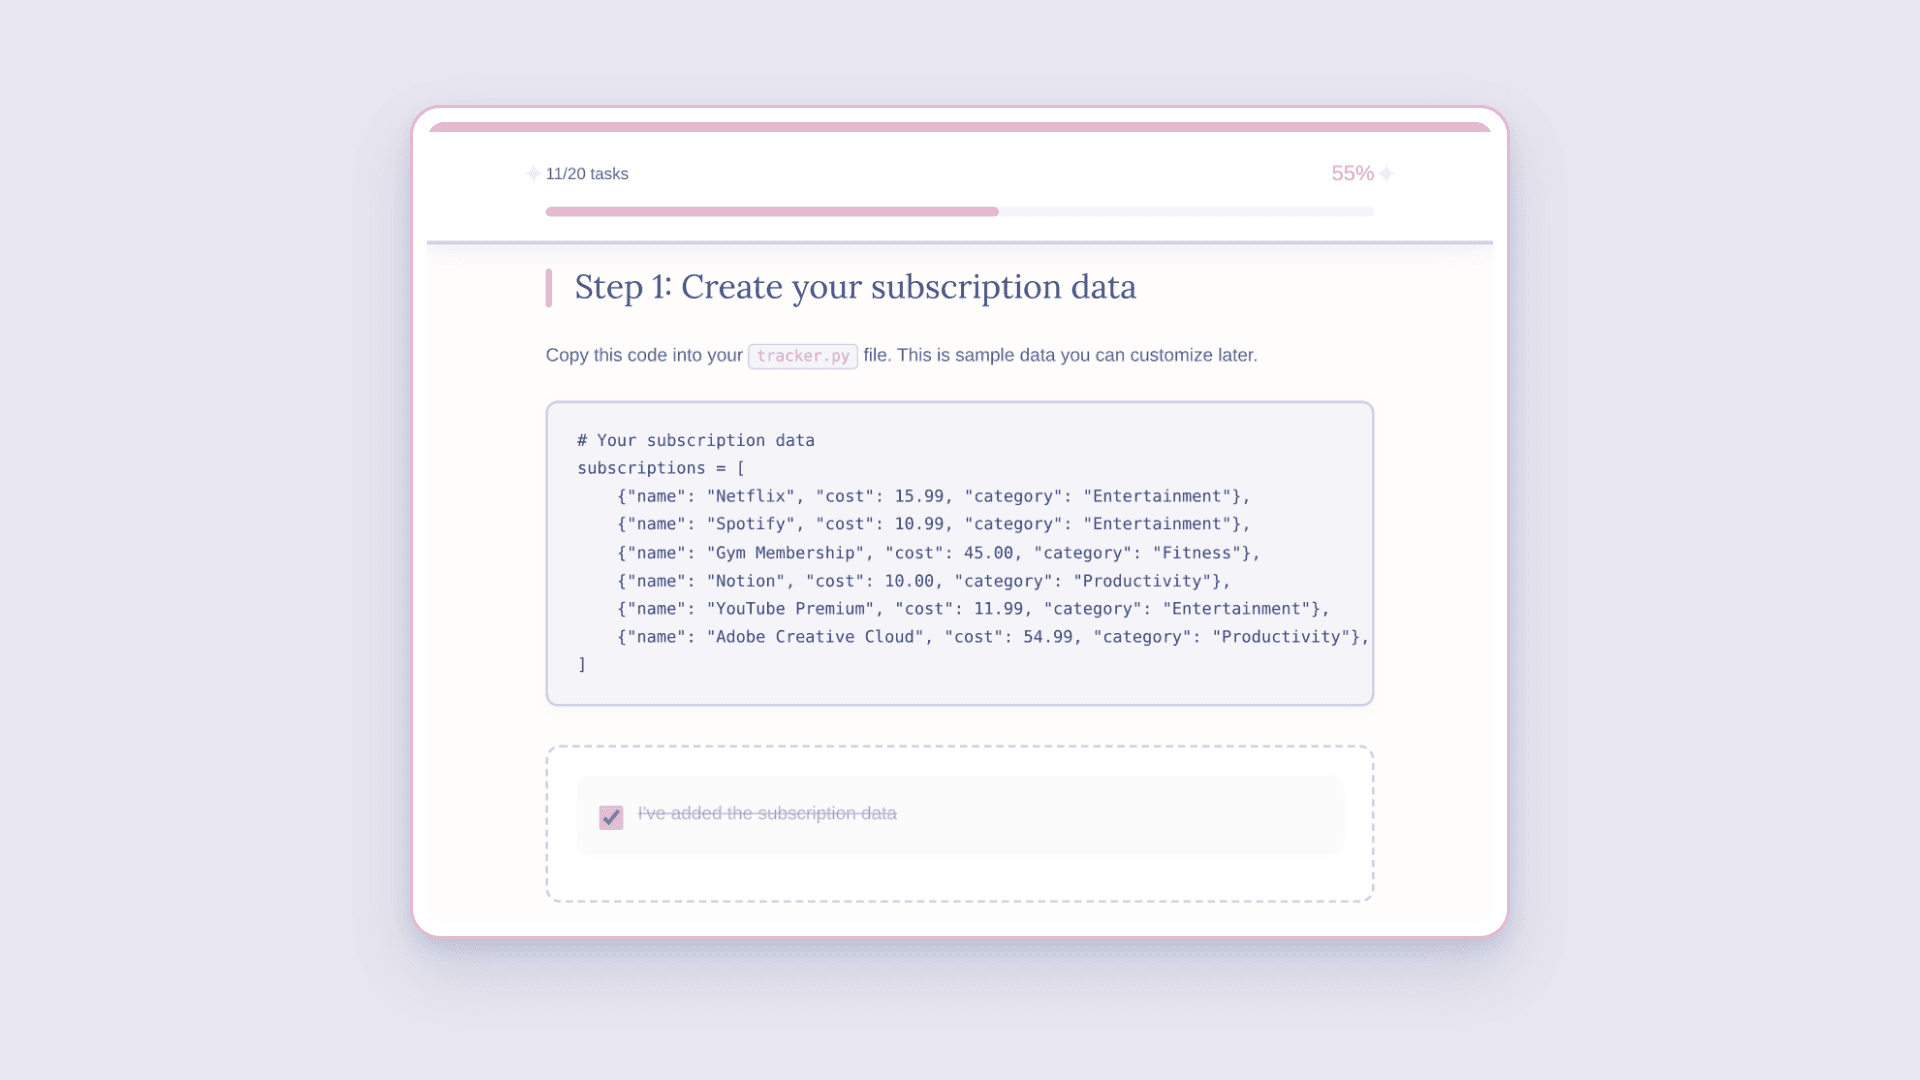
In this pack, you’ll build a Python subscription tracker that shows exactly where your money goes each month, ending in a pie chart you can save and share.
You’ll build it in three steps:
A neat list of your subscriptions with monthly and yearly totals
A breakdown of your spending by category, with percentages
A colorful pie chart of where it all goes
What’s inside:
A step-by-step guide with tasks you can check off as you go (your progress saves automatically)
A start-here page so you know exactly where to begin
The full tracker code at the end, so you can compare as you go
Once it works, swap in your real subscriptions and watch the totals and chart update on their own.
You’ll need a computer, Python, and VS Code (all free). The guide walks you through setting everything up. Plan on about 3–5 hours.
This is a digital download for personal use. All sales are final.